from pathlib import Path
import pandas as pd
import tarfile
import urllib.request

def load_housing_data():
    tarball_path = Path("datasets/housing.tgz")
    if not tarball_path.is_file():
        Path("datasets").mkdir(parents=True, exist_ok=True)
        url = "https://github.com/ageron/data/raw/main/housing.tgz"
        urllib.request.urlretrieve(url, tarball_path)
    with tarfile.open(tarball_path) as housing_tarball:
            housing_tarball.extractall(path="datasets", filter='data')
    return pd.read_csv(Path("datasets/housing/housing.csv"))
1. Introduction to Data Science
1.3 End-to-End Machine Learning Project
In this section, you will work through an example project end to end, pretending to be a recently hired data scientist at a real estate company. The goal of this example is to illustrate the main steps of a machine learning project, not to learn everything about the real estate business. Here are the main steps we will go through:
- Look at the big picture: What is the business problem we are trying to solve? How can we measure success? What is the current solution?
- Get the data: Where does the data come from? How can we get it?
- Explore and visualize the data to gain insights: What is in the data? What are the main characteristics of the data? What are the relationships between different attributes?
- Prepare the data for machine learning algorithms: How can we clean the data? How can we transform the data into a format that is suitable for machine learning algorithms?
- Select and train a model: What are the different types of machine learning algorithms? How can we select the best algorithm for our problem? How can we train the model?
- Fine-tune the model: How can we improve the model’s performance? How can we select the best hyperparameters?
- Present the solution: How can we communicate the results to stakeholders? How can we present the solution in a way that is easy to understand?
- Launch, monitor, and maintain the system: How can we deploy the model in a production environment? How can we monitor the model’s performance over time? How can we update the model as new data becomes available?
1.3.1 Working with Real Data
When learning about machine learning, it is best to experiment with real-world data, not artificial datasets. Fortunately, there are thousands of open datasets to choose from, ranging across all sorts of domains. Here are a few places you can look to get data:
- Popular open data repositories:
- Meta portals that list many datasets:
- Other pages listing many popular data repositories:
In this example, we will use the California housing dataset, which contains information about various districts in California, including features such as median income, average house age, and average number of rooms. This dataset is available in the StatLib repository and is also included in the Scikit-learn library.
1.3.2 Look at the Big Picture
Our first task is to use California census data to build a model of housing prices in the state. This model should learn from this data and be able to predict the median housing price in any district, given all the other metrics.
The first question to ask is what exactly the business objective is. Building a model is probably not the end goal. How does the company expect to use and benefit from this model? Knowing the objective is important because it will determine how you frame the problem, which algorithms you will select, which performance measure you will use to evaluate your model, and how much effort you will spend tweaking it.
1.3.2.1 Pipelines
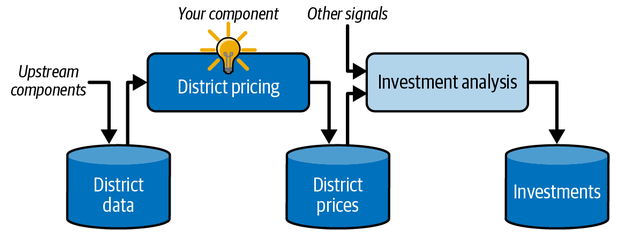
A sequence of data processing components is called a data pipeline. Pipelines are very common in machine learning systems, since there is a lot of data to manipulate and many data transformations to apply.
Components typically run asynchronously. Each component pulls in a large amount of data, processes it, and spits out the result in another data store. Then, some time later, the next component in the pipeline pulls in this data and spits out its own output. Each component is fairly self-contained: the interface between components is simply the data store. This makes the system simple to grasp (with the help of a data flow graph), and different teams can focus on different components. Moreover, if a component breaks down, the downstream components can often continue to run normally (at least for a while) by just using the last output from the broken component. This makes the architecture quite robust.
On the other hand, a broken component can go unnoticed for some time if proper monitoring is not implemented. The data gets stale and the overall system’s performance drops.
1.3.2.2 Frame the Problem
First, determine what kind of training supervision the model will need: is it a supervised, unsupervised, semi-supervised, self-supervised, or reinforcement learning task? And is it a classification task, a regression task, or something else? Should you use batch learning or online learning techniques? Before you read on, pause and try to answer these questions for yourself.
This is clearly a typical supervised learning task, since the model can be trained with labeled examples (each instance comes with the expected output, i.e., the district’s median housing price). It is a typical regression task, since the model will be asked to predict a value. More specifically, this is a multiple regression problem, since the system will use multiple features to make a prediction (the district’s population, the median income, etc.). It is also a univariate regression problem, since we are only trying to predict a single value for each district. If we were trying to predict multiple values per district, it would be a multivariate regression problem. Finally, there is no continuous flow of data coming into the system, there is no particular need to adjust changing data rapidly, and data is small enough to fit in memory, so plain batch learning should do just fine.
1.3.2.3 Select a Performance Measure
A typical performance measure for regression problems is the Root Mean Square Error (RMSE). It gives an idea of how much error the system typically makes in its predictions, with a higher weight given to large errors.
\[ RMSE(\textbf{X}, h) = \sqrt{\frac{1}{m} \sum_{i=1}^{m} \left( h(\textbf{x}^{(i)}) - y^{(i)} \right) ^2} \]
where:
- \(\textbf{x}^{(i)}\) is a vector of all the feature values of the \(i^{th}\) instance in the dataset \(\textbf{X}\), and \(y^{(i)}\) is the corresponding target value or label (the median housing price in this case).
- \(\textbf{X}\) is a matrix containing all the feature values (excluding labels) of all instances in the dataset. There is one row per instance, and the \(i^{th}\) row contains is equal to the transpose of the feature vector \(\textbf{x}^{(i)}\).
- \(m\) is the number of instances in the dataset \(\textbf{X}\)
- \(h\) is your system’s prediction function, also called hypothesis. When a system is given instance’s feature vector \(\textbf{x}^{(i)}\), it outputs a predicted value \(\hat{y}^{(i)} = h(\textbf{x}^{(i)})\) for that instance.
Although the RMSE is generally the preferred performance measure for regression tasks, in some contexts you may prefer to use another function. For example, if there are many outliers in the data, you may want to use the Mean Absolute Error (MAE) instead, since it is less sensitive to outliers.
\[ MAE(\textbf{X}, h) = \frac{1}{m} \sum_{i=1}^{m} | h(\textbf{x}^{(i)}) - y^{(i)} | \]
1.3.3 Get the Data
In typical environments your data would be available in a relational database or some other common data store, and spread across multiple tables/documents/files. To access it, you would first need to get your credentials and access authorizations and familiarize yourself with the data schema. In this project, however, things are much simpler: We are going to download a single compressed file, housing.tgz, which contains a comma-separated values (CSV) file called housing.csv with all the data
1.3.3.1 Take a Quick Look at the Data Structure
housing = load_housing_data()
housing| longitude | latitude | housing_median_age | total_rooms | total_bedrooms | population | households | median_income | median_house_value | ocean_proximity | |
|---|---|---|---|---|---|---|---|---|---|---|
| 0 | -122.23 | 37.88 | 41.0 | 880.0 | 129.0 | 322.0 | 126.0 | 8.3252 | 452600.0 | NEAR BAY |
| 1 | -122.22 | 37.86 | 21.0 | 7099.0 | 1106.0 | 2401.0 | 1138.0 | 8.3014 | 358500.0 | NEAR BAY |
| 2 | -122.24 | 37.85 | 52.0 | 1467.0 | 190.0 | 496.0 | 177.0 | 7.2574 | 352100.0 | NEAR BAY |
| 3 | -122.25 | 37.85 | 52.0 | 1274.0 | 235.0 | 558.0 | 219.0 | 5.6431 | 341300.0 | NEAR BAY |
| 4 | -122.25 | 37.85 | 52.0 | 1627.0 | 280.0 | 565.0 | 259.0 | 3.8462 | 342200.0 | NEAR BAY |
| ... | ... | ... | ... | ... | ... | ... | ... | ... | ... | ... |
| 20635 | -121.09 | 39.48 | 25.0 | 1665.0 | 374.0 | 845.0 | 330.0 | 1.5603 | 78100.0 | INLAND |
| 20636 | -121.21 | 39.49 | 18.0 | 697.0 | 150.0 | 356.0 | 114.0 | 2.5568 | 77100.0 | INLAND |
| 20637 | -121.22 | 39.43 | 17.0 | 2254.0 | 485.0 | 1007.0 | 433.0 | 1.7000 | 92300.0 | INLAND |
| 20638 | -121.32 | 39.43 | 18.0 | 1860.0 | 409.0 | 741.0 | 349.0 | 1.8672 | 84700.0 | INLAND |
| 20639 | -121.24 | 39.37 | 16.0 | 2785.0 | 616.0 | 1387.0 | 530.0 | 2.3886 | 89400.0 | INLAND |
20640 rows × 10 columns
The info() method is useful to get a quick description of the data, in particular the total number of rows, each attribute’s type, and the number of non-null val
housing.info()<class 'pandas.core.frame.DataFrame'>
RangeIndex: 20640 entries, 0 to 20639
Data columns (total 10 columns):
# Column Non-Null Count Dtype
--- ------ -------------- -----
0 longitude 20640 non-null float64
1 latitude 20640 non-null float64
2 housing_median_age 20640 non-null float64
3 total_rooms 20640 non-null float64
4 total_bedrooms 20433 non-null float64
5 population 20640 non-null float64
6 households 20640 non-null float64
7 median_income 20640 non-null float64
8 median_house_value 20640 non-null float64
9 ocean_proximity 20640 non-null object
dtypes: float64(9), object(1)
memory usage: 1.6+ MBhousing['ocean_proximity'].value_counts()ocean_proximity
<1H OCEAN 9136
INLAND 6551
NEAR OCEAN 2658
NEAR BAY 2290
ISLAND 5
Name: count, dtype: int64housing.describe()| longitude | latitude | housing_median_age | total_rooms | total_bedrooms | population | households | median_income | median_house_value | |
|---|---|---|---|---|---|---|---|---|---|
| count | 20640.000000 | 20640.000000 | 20640.000000 | 20640.000000 | 20433.000000 | 20640.000000 | 20640.000000 | 20640.000000 | 20640.000000 |
| mean | -119.569704 | 35.631861 | 28.639486 | 2635.763081 | 537.870553 | 1425.476744 | 499.539680 | 3.870671 | 206855.816909 |
| std | 2.003532 | 2.135952 | 12.585558 | 2181.615252 | 421.385070 | 1132.462122 | 382.329753 | 1.899822 | 115395.615874 |
| min | -124.350000 | 32.540000 | 1.000000 | 2.000000 | 1.000000 | 3.000000 | 1.000000 | 0.499900 | 14999.000000 |
| 25% | -121.800000 | 33.930000 | 18.000000 | 1447.750000 | 296.000000 | 787.000000 | 280.000000 | 2.563400 | 119600.000000 |
| 50% | -118.490000 | 34.260000 | 29.000000 | 2127.000000 | 435.000000 | 1166.000000 | 409.000000 | 3.534800 | 179700.000000 |
| 75% | -118.010000 | 37.710000 | 37.000000 | 3148.000000 | 647.000000 | 1725.000000 | 605.000000 | 4.743250 | 264725.000000 |
| max | -114.310000 | 41.950000 | 52.000000 | 39320.000000 | 6445.000000 | 35682.000000 | 6082.000000 | 15.000100 | 500001.000000 |
The count, mean, min, and max rows are self-explanatory. Note that the null values are ignored (so, for example, the count of total_bedrooms is 20,433, not 20,640). The std row shows the standard deviation, which measures how dispersed the values are. The 25%, 50%, and 75% rows show the corresponding percentiles: a percentile indicates the value below which a given percentage of observations in a group of observations fall. For example, 25% of the districts have a housing_median_age lower than 18, while 50% are lower than 29 and 75% are lower than 37. These are often called the 25th percentile (or first quartile), the median, and the 75th percentile (or third quartile).
Another quick way to get a feel of the type of data you are dealing with is to plot a histogram for each numerical attribute. A histogram shows the number of instances (on the vertical axis) that have given a value range (on the horizontal axis). You can either plot this one attribute at a time, or you can call the hist() method on the entire DataFrame to plot a histogram for each numerical attribute. Here is the result:
import matplotlib.pyplot as plt

housing.hist(bins=50, figsize=(16, 8))
plt.show()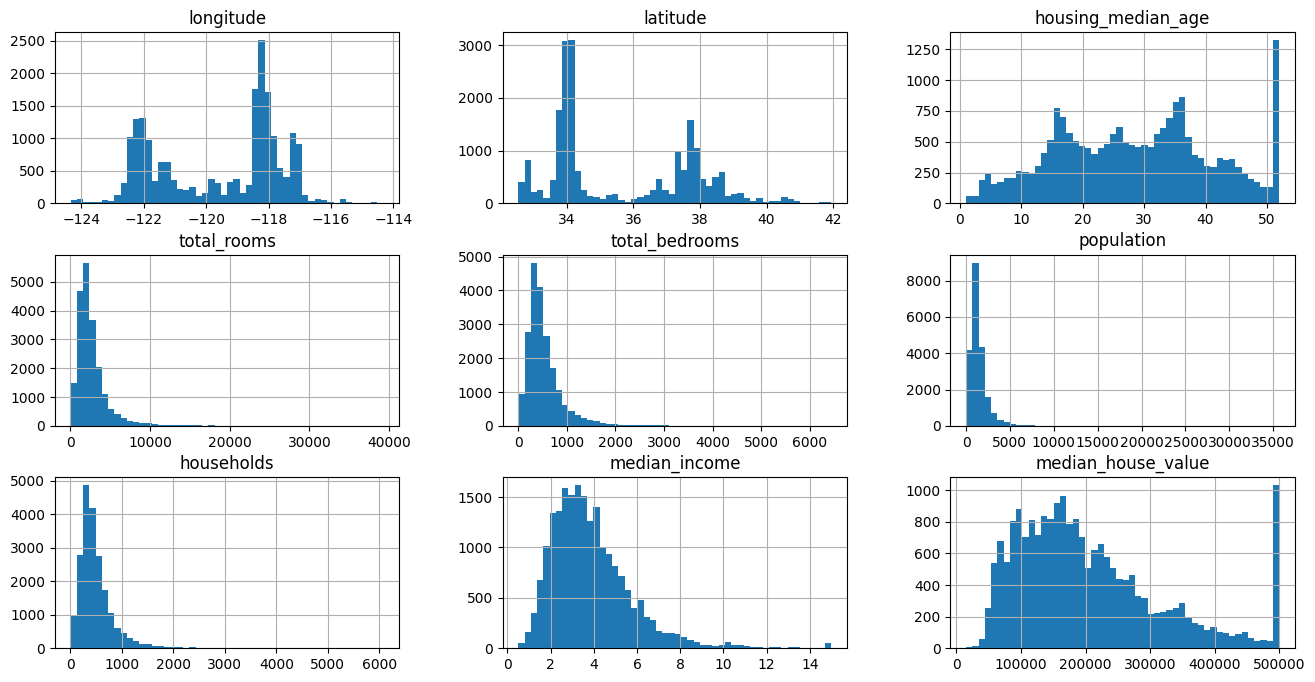
Looking at these histograms, you notice a few things:
- First, the median income attribute does not look like it is expressed in US dollars (USD). After checking with the team that collected the data, you are told that the data has been scaled and capped at 15 (actually, 15.0001) for higher median incomes, and at 0.5 (actually, 0.4999) for lower median incomes. The numbers represent roughly tens of thousands of dollars (e.g., 3 actually means about $30,000). Working with preprocessed attributes is common in machine learning, and it is not necessarily a problem, but you should try to understand how the data was computed.
- The housing median age and the median house value were also capped. The latter may be a serious problem since it is your target attribute (your labels). Your machine learning algorithms may learn that prices never go beyond that limit. You need to check with your client team (the team that will use your system’s output) to see if this is a problem or not. If they tell you that they need precise predictions even beyond $500,000, then you have two options:
- Collect proper labels for the districts whose labels were capped.
- Remove those districts from the training set (and also from the test set, since your system should not be evaluated poorly if it predicts values beyond $500,000).
- These attributes have very different scales. We will discuss this later in this chapter, when we explore feature scaling.
- Finally, many histograms are skewed right: they extend much farther to the right of the median than to the left. This may make it a bit harder for some machine learning algorithms to detect patterns in the data. Later, we’ll try to tranform these attributes to have a more symmetrical and bell-shaped distribution.
1.3.3.2 Create a Test Set
It may seem strange to voluntarily set aside part of the data at this stage. After all, you have only taken a quick glance at the data, and surely you should learn a whole lot more about it before you decide what algorithms to use, right? This is true, but your brain is an amazing pattern detection system, which also means that it is highly prone to overfitting: if you look at the test set, you may stumble upon some seemingly interesting pattern in the test data that leads you to select a particular kind of machine learning model. When you estimate the generalization error using the test set, your estimate will be too optimistic, and you will launch a system that will not perform as well as expected. This is called data snooping bias.
Creating a test set is theoretically simple; pick some instances randomly, typically 20% of the dataset (or less if your dataset is very large), and set them aside.
Scikit-Learn provides a few functions to split datasets into multiple subsets in various ways. The simplest function is train_test_split(). There is a random_state parameter that allows you to set the random generator seed. Second, you can pass it multiple datasets with an identical number of rows, and it will split them on the same indices (this is useful when you have a separate set of labels). Here is how to use it:
from sklearn.model_selection import train_test_split

train_set, test_set = train_test_split(housing, test_size=0.2, random_state=42)
However, we are considering a purely random sampling method. This is generally fine if your dataset is large enough (especially relative to the number of attributes), but if it is not, you run the risk of introducing a significant sampling bias. When employees at a survey company decides to call 1,000 people to ask them a few questions, they don’t just pick 1,000 people randomly in a phone book. They try to ensure that these 1,000 people are representative of the whole population, with regard to the questions they want to ask. For example, the US population is 51.1% females and 48.9% males, so a well-conducted survey in the US would try to maintain this ratio in the sample: 511 females and 489 males (at least if it seems possible that the answers may vary across genders). This is called stratified sampling: the population is divided into homogeneous subgroups called strata, and the right number of instances are sampled from each stratum to guarantee that the test set is representative of the overall population. If the people running the survey used purely random sampling, there would be about a 10.7% chance of sampling a skewed test set with less than 48.5% female or more than 53.5% female participants. Either way, the survey results would likely be quite biased.
Suppose you’ve chatted with some experts who told you that the median income is a very important attribute to predict median housing prices. You may want to ensure that the test set is representative of the various categories of incomes in the whole dataset. Since the median income is a continuous numerical attribute, you first need to create an income category attribute. Let’s look at the median income histogram more closely (back in Figure 2-8): most median income values are clustered around 1.5 to 6 (i.e., $15,000–$60,000), but some median incomes go far beyond 6. It is important to have a sufficient number of instances in your dataset for each stratum, or else the estimate of a stratum’s importance may be biased. This means that you should not have too many strata, and each stratum should be large enough. The following code uses the pd.cut() function to create an income category attribute with five categories (labeled from 1 to 5); category 1 ranges from 0 to 1.5 (i.e., less than $15,000), category 2 from 1.5 to 3, and so on:
housing['income_cat'] = pd.cut(housing['median_income'],
                               bins=[0., 1.5, 3.0, 4.5, 6., float('inf')],
                               labels=[1, 2, 3, 4, 5])

housing['income_cat'].value_counts().sort_index().plot.bar(rot=0, grid=True)
plt.xlabel('Income Category')
plt.ylabel('Number of Districts')
plt.show()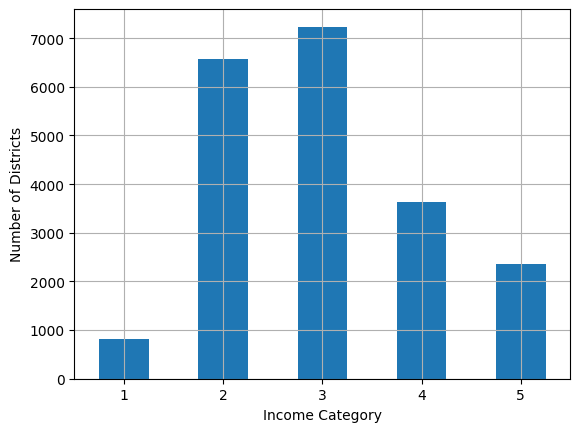
We can use the train_test_split() function with the stratify parameter to perform stratified sampling based on the income category:
strat_train_set, strat_test_set = train_test_split(housing, test_size=0.2, random_state=42, stratify=housing['income_cat'])

strat_test_set['income_cat'].value_counts() / len(strat_test_set)
income_cat
3 0.350533
2 0.318798
4 0.176357
5 0.114341
1 0.039971
Name: count, dtype: float64# extra code – computes the data for proportions in the full dataset
def income_cat_proportions(data):
return data["income_cat"].value_counts() / len(data)
train_set, test_set = train_test_split(housing, test_size=0.2, random_state=42)
compare_props = pd.DataFrame({
"Overall %": income_cat_proportions(housing),
"Stratified %": income_cat_proportions(strat_test_set),
"Random %": income_cat_proportions(test_set),
}).sort_index()
compare_props.index.name = "Income Category"
compare_props["Strat. Error %"] = (compare_props["Stratified %"] / compare_props["Overall %"] - 1)
compare_props["Rand. Error %"] = (compare_props["Random %"] / compare_props["Overall %"] - 1)
(compare_props * 100).round(2)| Overall % | Stratified % | Random % | Strat. Error % | Rand. Error % | |
|---|---|---|---|---|---|
| Income Category | |||||
| 1 | 3.98 | 4.00 | 4.24 | 0.36 | 6.45 |
| 2 | 31.88 | 31.88 | 30.74 | -0.02 | -3.59 |
| 3 | 35.06 | 35.05 | 34.52 | -0.01 | -1.53 |
| 4 | 17.63 | 17.64 | 18.41 | 0.03 | 4.42 |
| 5 | 11.44 | 11.43 | 12.09 | -0.08 | 5.63 |
# We can now remove the `income_cat` attribute so the data is back to its original state.
for set_ in (strat_train_set, strat_test_set):
    set_.drop("income_cat", axis=1, inplace=True)
1.3.4 Explore and Visualize the Data to Gain Insights
First, make sure you have put the test set aside and you are only exploring the training set. Also, if the training set is very large, you may want to sample an exploration set, to make manipulations easy and fast during the exploration phase. In this case, the training set is quite small, so you can just work directly on the full set. Since we are going to modify the training set a lot during the exploration phase, it is a good idea to make a copy of it so that you can always go back to the original data if necessary:
housing = strat_train_set.copy()1.3.4.1 Visualizing Geographical Data
housing.plot(kind="scatter", x="longitude", y="latitude", grid=True)
# plt.savefig('img/1_2/bad_visualization.png')
plt.show()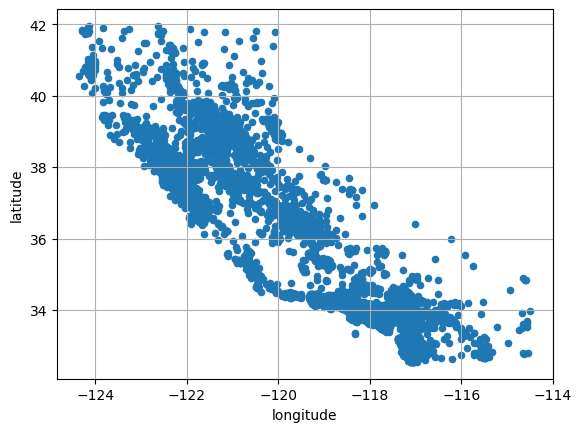
housing.plot(kind="scatter", x="longitude", y="latitude", alpha=0.2, grid=True)
# plt.savefig('img/1_2/better_visualization.png')
plt.show()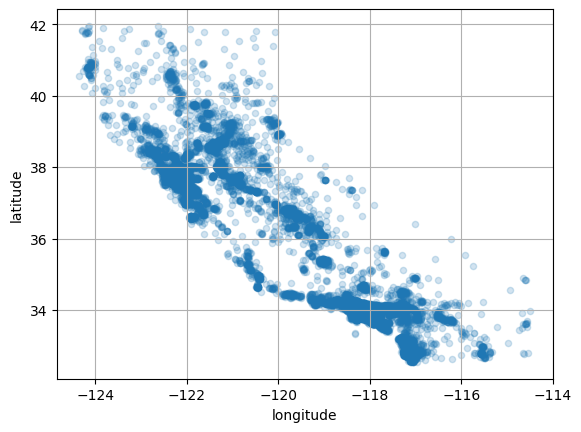
You can clearly see the high-density areas, namely the Bay Area and around Los Angeles and San Diego, plus a long line of fairly high-density areas in the Central Valley (in particular, around Sacramento and Fresno).
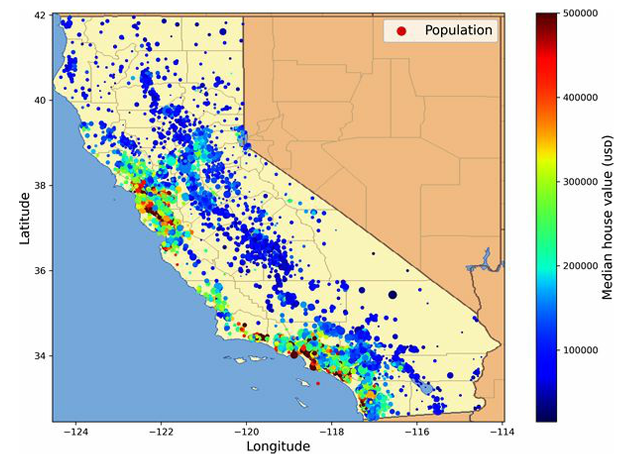
housing.plot(kind="scatter", x="longitude", y="latitude", grid=True,
             s=housing["population"] / 100, label="population",
             c="median_house_value", cmap="jet", colorbar=True,
             legend=True, sharex=False, figsize=(10, 7))
# plt.savefig("img/1_2/housing_prices_scatterplot.png")
plt.show()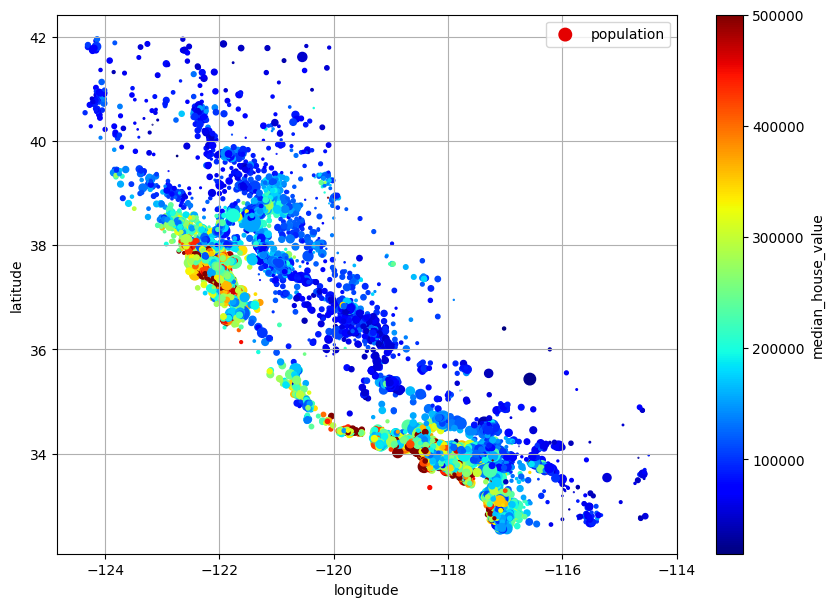
This picture tells you that the housing prices are much related to the location (e.g. close to the ocean) and to the population density (the size of each circle is proportional to the district’s population). The ocean proximity attribute may be useful as well, although in Northern California the prices in coastal districts are not too high, so it’s not a simple rule.
1.3.4.2 Look for Correlations
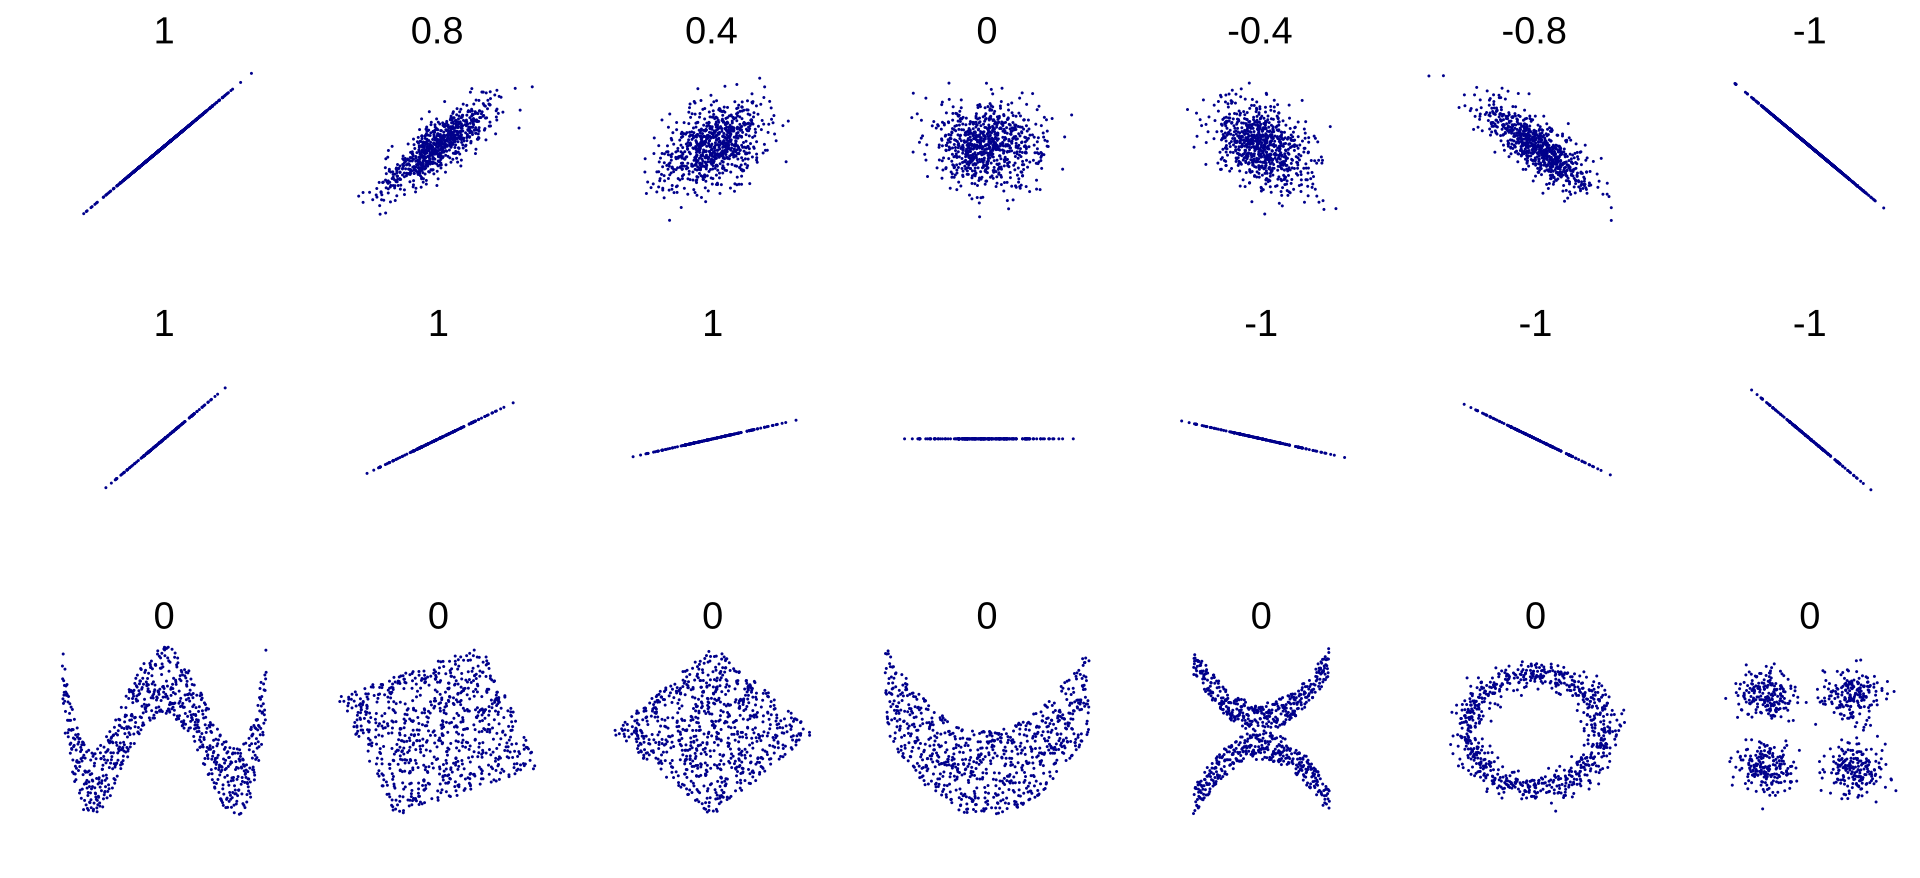
Since the dataset is not too large, you can easily compute the standard correlation coefficient (also called Pearson’s r) between every pair of attributes using the corr() method:
corr_matrix = housing.corr(numeric_only=True)
corr_matrix["median_house_value"].sort_values(ascending=False)
median_house_value 1.000000
median_income 0.688380
total_rooms 0.137455
housing_median_age 0.102175
households 0.071426
total_bedrooms 0.054635
population -0.020153
longitude -0.050859
latitude -0.139584
Name: median_house_value, dtype: float64Another way to check for correlation between attributes is to use the Pandas scatter_matrix() function, which plots every numerical attribute against every other numerical attribute. We decide to focus on a few promising attributes (including the target attribute, median_house_value):
from pandas.plotting import scatter_matrix

attributes = ["median_house_value", "median_income", "total_rooms",
              "housing_median_age"]
scatter_matrix(housing[attributes], figsize=(12, 8))
# plt.savefig("img/1_2/scatter_matrix_plot.png")
plt.show()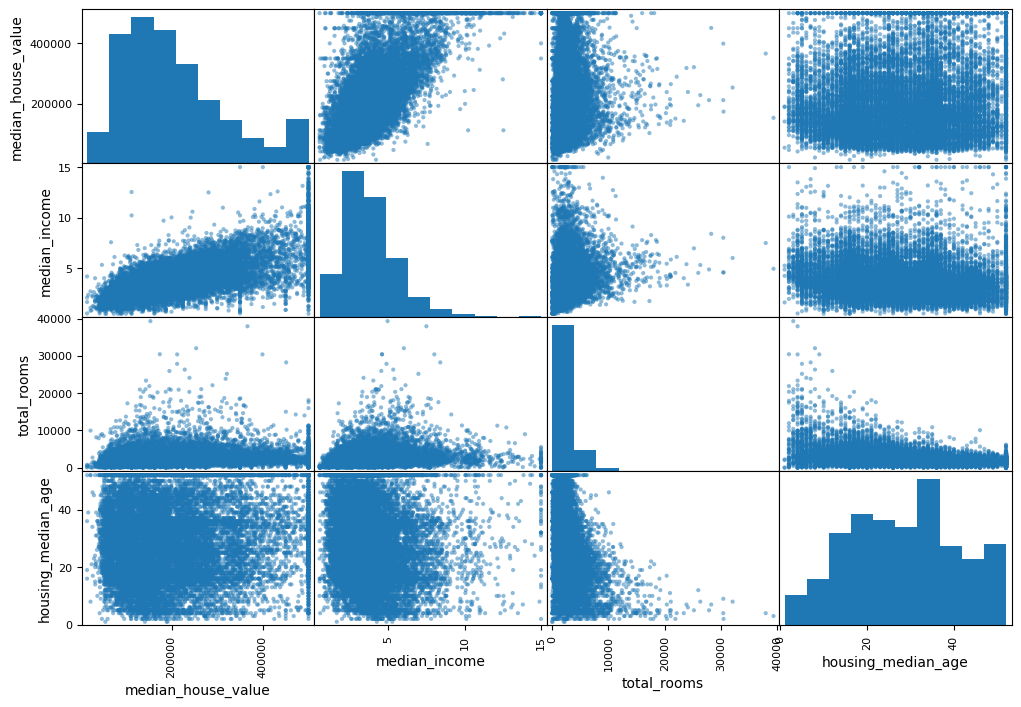
housing.plot(kind="scatter", x="median_income", y="median_house_value",
             alpha=0.1, grid=True)
# plt.savefig("img/1_2/income_vs_house_value_scatterplot.png")
plt.show()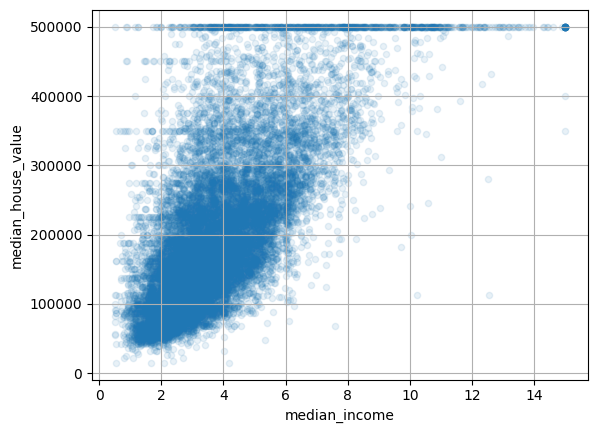
This plot reveals a few things. First, correlation is indeed quite strong; you can clearly see the upward trend, and the points are not too dispersed. Second, the price cap you noticed earlier is clearly visible as a horizontal line around $500,000. But the plot also reveals other less obvious straight lines: a horizontal line around $450,000,another around $350,000, perhaps aone around $280,000, and a few vertical lines as well. You may want to try removing the corresponding districts to prevent your algorithms from learning these quirks.
1.3.4.3 Experiment with Attribute Combinations
One last thing you may want to do before preparing the data for machine learning algorithms is to try out various attribute combinations. For example, the total number of rooms in a district is not very useful if you don’t know how many households there are. What you really want is the number of rooms per household. Similarly, the total number of bedrooms by itself is not very useful: you probably want to compare it to the number of rooms. And the population per household also seems like an interesting attribute combination to look at. You create these new attributes as follows:
housing["rooms_per_house"] = housing["total_rooms"] / housing["households"]
housing["bedrooms_ratio"] = housing["total_bedrooms"] / housing["total_rooms"]
housing["people_per_house"] = housing["population"] / housing["households"]
Then we can look at the correlation matrix again to see how these new attributes compare to the others:
corr_matrix = housing.corr(numeric_only=True)
corr_matrix["median_house_value"].sort_values(ascending=False)
median_house_value 1.000000
median_income 0.688380
rooms_per_house 0.143663
total_rooms 0.137455
housing_median_age 0.102175
households 0.071426
total_bedrooms 0.054635
population -0.020153
people_per_house -0.038224
longitude -0.050859
latitude -0.139584
bedrooms_ratio -0.256397
Name: median_house_value, dtype: float64The new bedrooms_ratio attribute is much more correlated with the median house value than the total number of rooms or bedrooms. It’s a strong negative correlation, so it looks like houses with a lower bedroom/room ratio tend to be more expensive. The number of rooms per household is also more informative than the total number of rooms in a district -obviously the larger the houses, the more expensive they are.
This round of exploration does not have to be absolutely thorough; the point is to start off on the right foot and quickly gain insights that will help you get a first reasonably good prototype. But this is an iterative process: once you get a prototype up and running, you can analyze its output to gain more insights and come back to this exploration step.
1.3.5 Prepare the Data for Machine Learning Algorithms
Let’s revert to the original training set and separate the target (note that strat_train_set.drop() creates a copy of strat_train_set without the column, it doesn’t actually modify strat_train_set itself, unless you pass inplace=True):
housing = strat_train_set.drop("median_house_value", axis=1)
housing_labels = strat_train_set["median_house_value"].copy()
1.3.5.1 Data Cleaning
Most machine learning algorithms cannot work with missing features, so you’ll need to take care of these. For example, you noticed earlier that the total_bedrooms attribute has some missing values. You have three options to fix this:
Get rid of the corresponding districts.
Get rid of the whole attribute.
Set the missing values to some value (zero, the mean, the median, etc.). This is called imputation.
You can accomplish these easily using the Pandas DataFrame’s dropna(), drop(), and fillna() methods:
housing.dropna(subset=["total_bedrooms"], inplace=True)  # option 1

housing.drop("total_bedrooms", axis=1, inplace=True)  # option 2

median = housing["total_bedrooms"].median()  # option 3
housing["total_bedrooms"] = housing["total_bedrooms"].fillna(median)
It seems best to go for option 3 since it is the least destructive, but instead of the preceding code, we can use a handy Scikit-Learn class: SimpleImputer. The benefit is that it will store the median value of each feature: this will make it possible to impute missing values not only on the training set, but also on the validation set, the test set, and any new data fed to the model. To use it, first you need to create a SimpleImputer instance, specifying that you want to replace each attribute’s missing values with the median of that attribute:
from sklearn.impute import SimpleImputer

imputer = SimpleImputer(strategy="median")
Separating out the numerical attributes to use the “median” strategy (as it cannot be calculated on text attributes like ocean_proximity):
import numpy as np

housing_num = housing.select_dtypes(include=[np.number])
imputer.fit(housing_num)SimpleImputer(strategy='median')In a Jupyter environment, please rerun this cell to show the HTML representation or trust the notebook.
On GitHub, the HTML representation is unable to render, please try loading this page with nbviewer.org.
Parameters
| missing_values | nan | |
| strategy | 'median' | |
| fill_value | None | |
| copy | True | |
| add_indicator | False | |
| keep_empty_features | False |
The imputer has simply computed the median of each attribute and stored the result in its statistics_ instance variable. Only the total_bedrooms attribute had missing values, but you cannot be sure that there won’t be any missing values in new data after the system goes live, so it is safer to apply the imputer to all the numerical attributes:
imputer.statistics_array([-118.51 , 34.26 , 29. , 2125. , 434. , 1167. ,
408. , 3.5385])housing_num.median()longitude -118.5100
latitude 34.2600
housing_median_age 29.0000
total_rooms 2125.0000
total_bedrooms 434.0000
population 1167.0000
households 408.0000
median_income 3.5385
dtype: float64Transforming the training set:
X = imputer.transform(housing_num)
housing_tr = pd.DataFrame(X, columns=housing_num.columns, index=housing_num.index)
housing_tr

#from sklearn import set_config
# set_config(transform_output="pandas") # scikit-learn >= 1.2| longitude | latitude | housing_median_age | total_rooms | total_bedrooms | population | households | median_income | |
|---|---|---|---|---|---|---|---|---|
| 13096 | -122.42 | 37.80 | 52.0 | 3321.0 | 1115.0 | 1576.0 | 1034.0 | 2.0987 |
| 14973 | -118.38 | 34.14 | 40.0 | 1965.0 | 354.0 | 666.0 | 357.0 | 6.0876 |
| 3785 | -121.98 | 38.36 | 33.0 | 1083.0 | 217.0 | 562.0 | 203.0 | 2.4330 |
| 14689 | -117.11 | 33.75 | 17.0 | 4174.0 | 851.0 | 1845.0 | 780.0 | 2.2618 |
| 20507 | -118.15 | 33.77 | 36.0 | 4366.0 | 1211.0 | 1912.0 | 1172.0 | 3.5292 |
| ... | ... | ... | ... | ... | ... | ... | ... | ... |
| 14207 | -118.40 | 33.86 | 41.0 | 2237.0 | 597.0 | 938.0 | 523.0 | 4.7105 |
| 13105 | -119.31 | 36.32 | 23.0 | 2945.0 | 592.0 | 1419.0 | 532.0 | 2.5733 |
| 19301 | -117.06 | 32.59 | 13.0 | 3920.0 | 775.0 | 2814.0 | 760.0 | 4.0616 |
| 19121 | -118.40 | 34.06 | 37.0 | 3781.0 | 873.0 | 1725.0 | 838.0 | 4.1455 |
| 19888 | -122.41 | 37.66 | 44.0 | 431.0 | 195.0 | 682.0 | 212.0 | 3.2833 |
16512 rows × 8 columns
Missing values can also be replaced with the mean value (strategy="mean"), or with the most frequent value (strategy="most_frequent"), or with a constant value (strategy="constant", fill_value=…). The last two strategies support non-numerical data.
There are also more powerful imputers available in the sklearn.impute package (both for numerical features only):
KNNImputerreplaces each missing value with the mean of the k-nearest neighbors’ values for that feature. The distance is based on all the available features.IterativeImputertrains a regression model per feature to predict the missing values based on all the other available features. It then trains the model again on the updated data, and repeats the process several times, improving the models and the replacement values at each iteration.
Now let’s drop some outliers:
from sklearn.ensemble import IsolationForest

isolation_forest = IsolationForest(random_state=42)
outlier_pred = isolation_forest.fit_predict(X)
outlier_pred
array([-1, 1, 1, ..., 1, 1, 1], shape=(16512,))If you wanted to drop outliers, you would run the following code:
# housing = housing.iloc[outlier_pred == 1]
# housing_labels = housing_labels.iloc[outlier_pred == 1]
For you to understand how Isolation Forest works under the hood, the following articles are recommended:
1.3.5.2 Handling Text and Categorical Attributes
Now let’s preprocess the categorical input feature, ocean_proximity:
housing_cat = housing[["ocean_proximity"]]
housing_cat.head(10)| ocean_proximity | |
|---|---|
| 13096 | NEAR BAY |
| 14973 | <1H OCEAN |
| 3785 | INLAND |
| 14689 | INLAND |
| 20507 | NEAR OCEAN |
| 1286 | INLAND |
| 18078 | <1H OCEAN |
| 4396 | NEAR BAY |
| 18031 | <1H OCEAN |
| 6753 | <1H OCEAN |
from sklearn.preprocessing import OrdinalEncoder

ordinal_encoder = OrdinalEncoder()
housing_cat_encoded = ordinal_encoder.fit_transform(housing_cat)housing_cat_encoded[:10]array([[3.],
[0.],
[1.],
[1.],
[4.],
[1.],
[0.],
[3.],
[0.],
[0.]])ordinal_encoder.categories_[array(['<1H OCEAN', 'INLAND', 'ISLAND', 'NEAR BAY', 'NEAR OCEAN'],
dtype=object)]from sklearn.preprocessing import OneHotEncoder
cat_encoder = OneHotEncoder()
housing_cat_1hot = cat_encoder.fit_transform(housing_cat)housing_cat_1hot<Compressed Sparse Row sparse matrix of dtype 'float64'
with 16512 stored elements and shape (16512, 5)>By default, the OneHotEncoder class returns a sparse array, but we can convert it to a dense array if needed by calling the toarray() method:
housing_cat_1hot.toarray()array([[0., 0., 0., 1., 0.],
[1., 0., 0., 0., 0.],
[0., 1., 0., 0., 0.],
...,
[0., 0., 0., 0., 1.],
[1., 0., 0., 0., 0.],
[0., 0., 0., 0., 1.]], shape=(16512, 5))Alternatively, you can set sparse_output=False when creating the OneHotEncoder
cat_encoder = OneHotEncoder(sparse_output=False)
housing_cat_1hot = cat_encoder.fit_transform(housing_cat)  # now a dense array
housing_cat_1hot
array([[0., 0., 0., 1., 0.],
[1., 0., 0., 0., 0.],
[0., 1., 0., 0., 0.],
...,
[0., 0., 0., 0., 1.],
[1., 0., 0., 0., 0.],
[0., 0., 0., 0., 1.]], shape=(16512, 5))cat_encoder.categories_[array(['<1H OCEAN', 'INLAND', 'ISLAND', 'NEAR BAY', 'NEAR OCEAN'],
dtype=object)]Pandas has a function called get_dummies(), which also converts each categorical feature into a one-hot representation, with one binary feature per category:
df_test = pd.DataFrame({"ocean_proximity": ["INLAND", "NEAR BAY"]})
pd.get_dummies(df_test)| ocean_proximity_INLAND | ocean_proximity_NEAR BAY | |
|---|---|---|
| 0 | True | False |
| 1 | False | True |
cat_encoder.transform(df_test)array([[0., 1., 0., 0., 0.],
[0., 0., 0., 1., 0.]])df_test_unknown = pd.DataFrame({"ocean_proximity": ["<2H OCEAN", "ISLAND"]})
pd.get_dummies(df_test_unknown)| ocean_proximity_<2H OCEAN | ocean_proximity_ISLAND | |
|---|---|---|
| 0 | True | False |
| 1 | False | True |
cat_encoder.handle_unknown = "ignore"
cat_encoder.transform(df_test_unknown)
array([[0., 0., 0., 0., 0.],
[0., 0., 1., 0., 0.]])cat_encoder.feature_names_in_array(['ocean_proximity'], dtype=object)cat_encoder.get_feature_names_out()array(['ocean_proximity_<1H OCEAN', 'ocean_proximity_INLAND',
'ocean_proximity_ISLAND', 'ocean_proximity_NEAR BAY',
'ocean_proximity_NEAR OCEAN'], dtype=object)df_output = pd.DataFrame(cat_encoder.transform(df_test_unknown),
columns=cat_encoder.get_feature_names_out(),
index=df_test_unknown.index)
df_output| ocean_proximity_<1H OCEAN | ocean_proximity_INLAND | ocean_proximity_ISLAND | ocean_proximity_NEAR BAY | ocean_proximity_NEAR OCEAN | |
|---|---|---|---|---|---|
| 0 | 0.0 | 0.0 | 0.0 | 0.0 | 0.0 |
| 1 | 0.0 | 0.0 | 1.0 | 0.0 | 0.0 |
1.3.5.3 Feature Scaling
One of the most important transformations you need to apply to your data is feature scaling. With few exceptions, machine learning algorithms don’t perform well when the input numerical attributes have very different scales. This is the case for the housing data: the total number of rooms ranges from about 6 to 39,320, while the median incomes only range from 0 to 15. Without any scaling, most models will be biased toward ignoring the median income and focusing more on the number of rooms.
There are two common ways to get all attributes to have the same scale: min-max scaling and standardization.
Warning: As with all estimators, it is important to fit the scalers to the training data only: never use fit() or fit_transform() for anything else than the training set. Once you have a trained scaler, you can then use it to transform() any other set, including the validation set, the test set, and new data.
Min-max scaling (many people call this normalization) is the simplest: for each attribute, the values are shifted and rescaled so that they end up ranging from 0 to 1. This is performed by subtracting the min value from all values, and dividing the results by the difference between the min and the max. Scikit-Learn provides a transformer called MinMaxScaler for this. It has a feature_range hyperparameter that lets you change the range if, for some reason, you don’t want 0–1 (e.g., neural networks work best with zero-mean inputs, so a range of –1 to 1 is preferable)
from sklearn.preprocessing import MinMaxScaler

min_max_scaler = MinMaxScaler(feature_range=(-1, 1))
housing_num_min_max_scaled = min_max_scaler.fit_transform(housing_num)
Standardization is different: first it subtracts the mean value (so standardized values have a zero mean), then it divides the result by the standard deviation (so standardized values have a standard deviation equal to 1). Unlike min-max scaling, standardization does not restrict values to a specific range. However, standardization is much less affected by outliers. For example, suppose a district has a median income equal to 100 (by mistake), instead of the usual 0–15. Min-max scaling to the 0–1 range would map this outlier down to 1 and it would crush all the other values down to 0–0.15, whereas standardization would not be much affected. Scikit-Learn provides a transformer called StandardScaler for standardization:
from sklearn.preprocessing import StandardScaler

std_scaler = StandardScaler()
housing_num_std_scaled = std_scaler.fit_transform(housing_num)
When a feature’s distribution has a heavy tail (i.e., when values far from the mean are not exponentially rare), both min-max scaling and standardization will squash most values into a small range. So before you scale the feature, you should first transform it to shrink the heavy tail, and if possible to make the distribution roughly symmetrical. For example, a common way to do this for positive features with a heavy tail to the right is to replace the feature with its square root (or raise the feature to a power between 0 and 1). If the feature has a really long and heavy tail, such as a power law distribution, then replacing the feature with its logarithm may help. For example, the population feature roughly follows a power law: districts with 10,000 inhabitants are only 10 times less frequent than districts with 1,000 inhabitants, not exponentially less frequent. Figure 2-17 shows how much better this feature looks when you compute its log: it’s very close to a Gaussian distribution (i.e., bell-shaped).
fig, axs = plt.subplots(1, 2, figsize=(8, 3), sharey=True)
housing["population"].hist(ax=axs[0], bins=50)
housing["population"].apply(np.log).hist(ax=axs[1], bins=50)
axs[0].set_xlabel("Population")
axs[1].set_xlabel("Log of population")
axs[0].set_ylabel("Number of districts")

plt.show()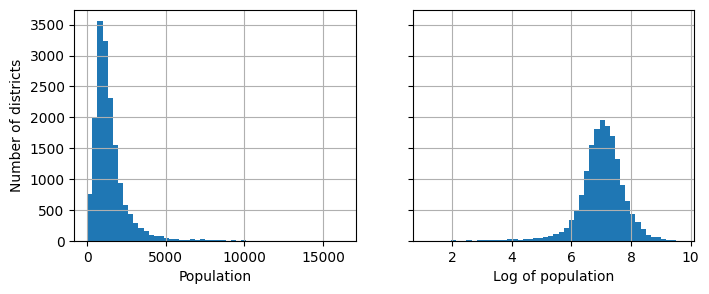
What if we replace each value with its percentile?
percentiles = [np.percentile(housing["median_income"], p) for p in range(1, 100)]
flattened_median_income = pd.cut(housing["median_income"],
                                 bins=[-np.inf] + percentiles + [np.inf],
                                 labels=range(1, 100 + 1))
flattened_median_income.hist(bins=50)
plt.xlabel("Median income percentile")
plt.ylabel("Number of districts")
plt.show()
# Note: incomes below the 1st percentile are labeled 1, and incomes above the
# 99th percentile are labeled 100. This is why the distribution below ranges
# from 1 to 100 (not 0 to 100).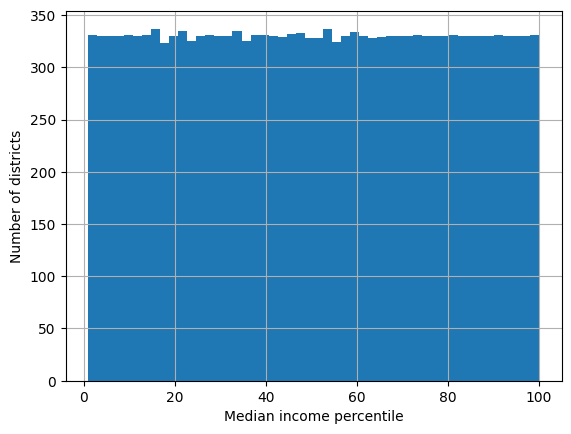
housing['median_income'].head()13096 2.0987
14973 6.0876
3785 2.4330
14689 2.2618
20507 3.5292
Name: median_income, dtype: float64Another approach to transforming multimodal distributions is to add a feature for each of the modes (at least the main ones), representing the similarity between the housing median age and that particular mode. The similarity measure is typically computed using a radial basis function (RBF)—any function that depends only on the distance between the input value and a fixed point. The most commonly used RBF is the Gaussian RBF, whose output value decays exponentially as the input value moves away from the fixed point. For example, the Gaussian RBF similarity between the housing age x and 35 is given by the equation exp(–γ(x – 35)²). The hyperparameter γ (gamma) determines how quickly the similarity measure decays as x moves away from 35. Using Scikit-Learn’s rbf_kernel() function, you can create a new Gaussian RBF feature measuring the similarity between the housing median age and 35:
from sklearn.metrics.pairwise import rbf_kernel

age_simil_35 = rbf_kernel(housing[["housing_median_age"]], [[35]], gamma=0.1)

# extra code – plots the age similarity feature along with the housing median age histogram
ages = np.linspace(housing["housing_median_age"].min(),
                   housing["housing_median_age"].max(),
                   500).reshape(-1, 1)
gamma1 = 0.1
gamma2 = 0.03
rbf1 = rbf_kernel(ages, [[35]], gamma=gamma1)
rbf2 = rbf_kernel(ages, [[35]], gamma=gamma2)

fig, ax1 = plt.subplots()

ax1.set_xlabel("Housing median age")
ax1.set_ylabel("Number of districts")
ax1.hist(housing["housing_median_age"], bins=50)

ax2 = ax1.twinx()  # create a twin axis that shares the same x-axis
color = "blue"
ax2.plot(ages, rbf1, color=color, label="gamma = 0.10")
ax2.plot(ages, rbf2, color=color, label="gamma = 0.03", linestyle="--")
ax2.tick_params(axis='y', labelcolor=color)
ax2.set_ylabel("Age similarity", color=color)

plt.legend(loc="upper left")

plt.show()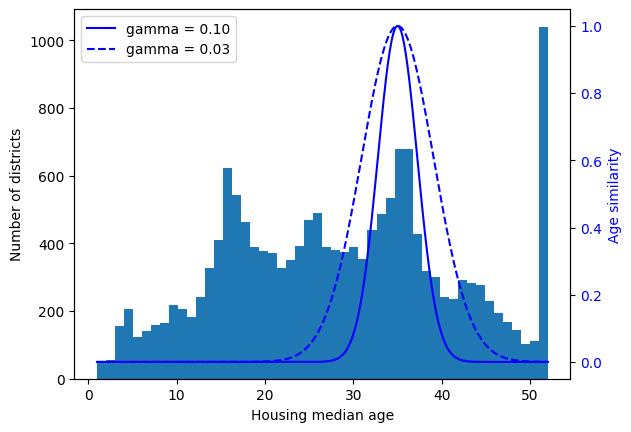
So far we’ve only looked at the input features, but the target values may also need to be transformed. For example, if the target distribution has a heavy tail, you may choose to replace the target with its logarithm. But if you do, the regression model will now predict the log of the median house value, not the median house value itself. You will need to compute the exponential of the model’s prediction if you want the predicted median house value.
housing_labels13096 458300.0
14973 483800.0
3785 101700.0
14689 96100.0
20507 361800.0
...
14207 500001.0
13105 88800.0
19301 148800.0
19121 500001.0
19888 233300.0
Name: median_house_value, Length: 16512, dtype: float64from sklearn.linear_model import LinearRegression
target_scaler = StandardScaler()
scaled_labels = target_scaler.fit_transform(housing_labels.to_frame())
model = LinearRegression()
model.fit(housing[["median_income"]], scaled_labels)
some_new_data = housing[["median_income"]].iloc[:5] # pretend this is new data
scaled_predictions = model.predict(some_new_data)
predictions = target_scaler.inverse_transform(scaled_predictions)
predictionsarray([[131997.15275877],
[299359.35844434],
[146023.37185694],
[138840.33653057],
[192016.61557639]])from sklearn.compose import TransformedTargetRegressor
model = TransformedTargetRegressor(LinearRegression(),
transformer=StandardScaler())
model.fit(housing[["median_income"]], housing_labels)
predictions = model.predict(some_new_data)
predictionsarray([131997.15275877, 299359.35844434, 146023.37185694, 138840.33653057,
192016.61557639])1.3.5.4 Custom Transformers
from sklearn.preprocessing import FunctionTransformer

log_transformer = FunctionTransformer(np.log, inverse_func=np.exp)
log_pop = log_transformer.transform(housing[["population"]])
log_pop| population | |
|---|---|
| 13096 | 7.362645 |
| 14973 | 6.501290 |
| 3785 | 6.331502 |
| 14689 | 7.520235 |
| 20507 | 7.555905 |
| ... | ... |
| 14207 | 6.843750 |
| 13105 | 7.257708 |
| 19301 | 7.942362 |
| 19121 | 7.452982 |
| 19888 | 6.525030 |
16512 rows × 1 columns
rbf_transformer = FunctionTransformer(rbf_kernel,
                                      kw_args=dict(Y=[[35.]], gamma=0.1))
age_simil_35 = rbf_transformer.transform(housing[["housing_median_age"]])
age_simil_35
array([[2.81118530e-13],
[8.20849986e-02],
[6.70320046e-01],
...,
[9.55316054e-22],
[6.70320046e-01],
[3.03539138e-04]], shape=(16512, 1))For example, here’s how to add a feature that will measure the geographic similarity between each district and San Francisco:
sf_coords = 37.7749, -122.41
sf_transformer = FunctionTransformer(rbf_kernel,
                                     kw_args=dict(Y=[sf_coords], gamma=0.1))
sf_simil = sf_transformer.transform(housing[["latitude", "longitude"]])
sf_simil
array([[0.999927 ],
[0.05258419],
[0.94864161],
...,
[0.00388525],
[0.05038518],
[0.99868067]], shape=(16512, 1))Custom transformers are also useful to combine features. For example, here’s a FunctionTransformer that computes the ratio between the input features 0 and 1:
ratio_transformer = FunctionTransformer(lambda X: X[:, [0]] / X[:, [1]])
ratio_transformer.transform(np.array([[1., 2.], [3., 4.]]))
array([[0.5 ],
[0.75]])FunctionTransformer is very handy, but what if you would like your transformer to be trainable, learning some parameters in the fit() method and using them later in the transform() method? For this, you need to write a custom class. For example, here’s a custom transformer that acts much like the StandardScaler:
from sklearn.base import BaseEstimator, TransformerMixin
from sklearn.utils.validation import check_array, check_is_fitted

class StandardScalerClone(BaseEstimator, TransformerMixin):
    def __init__(self, with_mean=True):  # no *args or **kwargs!
        self.with_mean = with_mean

    def fit(self, X, y=None):  # y is required even though we don't use it
        X = check_array(X)  # checks that X is an array with finite float values
        self.mean_ = X.mean(axis=0)
        self.scale_ = X.std(axis=0)
        self.n_features_in_ = X.shape[1]  # every estimator stores this in fit()
        return self  # always return self!

    def transform(self, X):
        check_is_fitted(self)  # looks for learned attributes (with trailing _)
        X = check_array(X)
        assert self.n_features_in_ == X.shape[1]
        if self.with_mean:
            X = X - self.mean_
        return X / self.scale_
A custom transformer can (and often does) use other estimators in its implementation. For example, the following code demonstrates a custom transformer that uses a KMeans clusterer in the fit() method to identify the main clusters in the training data, and then uses rbf_kernel() in the transform() method to measure how similar each sample is to each cluster center:
from sklearn.cluster import KMeans

class ClusterSimilarity(BaseEstimator, TransformerMixin):
    def __init__(self, n_clusters=10, gamma=1.0, random_state=None):
        self.n_clusters = n_clusters
        self.gamma = gamma
        self.random_state = random_state

    def fit(self, X, y=None, sample_weight=None):
        self.kmeans_ = KMeans(self.n_clusters, random_state=self.random_state)
        self.kmeans_.fit(X, sample_weight=sample_weight)
        return self  # always return self!

    def transform(self, X):
        return rbf_kernel(X, self.kmeans_.cluster_centers_, gamma=self.gamma)

    def get_feature_names_out(self, names=None):
        return [f"Cluster {i} similarity" for i in range(self.n_clusters)]
cluster_simil = ClusterSimilarity(n_clusters=10, gamma=1., random_state=42)
similarities = cluster_simil.fit_transform(housing[["latitude", "longitude"]],
sample_weight=housing_labels)This code creates a ClusterSimilarity transformer, setting the number of clusters to 10. Then it calls fit_transform() with the latitude and longitude of every district in the training set, weighting each district by its median house value. The transformer uses k-means to locate the clusters, then measures the Gaussian RBF similarity between each district and all 10 cluster centers. The result is a matrix with one row per district, and one column per cluster. Let’s look at the first five rows, rounding to two decimal places:
similarities[:5].round(2)array([[0. , 0.98, 0. , 0. , 0. , 0. , 0.13, 0.55, 0. , 0.56],
[0.64, 0. , 0.11, 0.04, 0. , 0. , 0. , 0. , 0.99, 0. ],
[0. , 0.65, 0. , 0. , 0.01, 0. , 0.49, 0.59, 0. , 0.28],
[0.63, 0. , 0. , 0.52, 0. , 0. , 0. , 0. , 0.2 , 0. ],
[0.87, 0. , 0.03, 0.14, 0. , 0. , 0. , 0. , 0.89, 0. ]])# extra code
housing_renamed = housing.rename(columns={
"latitude": "Latitude", "longitude": "Longitude",
"population": "Population",
"median_house_value": "Median house value (ᴜsᴅ)"})
housing_renamed["Max cluster similarity"] = similarities.max(axis=1)
housing_renamed.plot(kind="scatter", x="Longitude", y="Latitude", grid=True,
s=housing_renamed["Population"] / 100, label="Population",
c="Max cluster similarity",
cmap="jet", colorbar=True,
legend=True, sharex=False, figsize=(10, 7))
plt.plot(cluster_simil.kmeans_.cluster_centers_[:, 1],
cluster_simil.kmeans_.cluster_centers_[:, 0],
linestyle="", color="black", marker="X", markersize=20,
label="Cluster centers")
plt.legend(loc="upper right")
plt.show()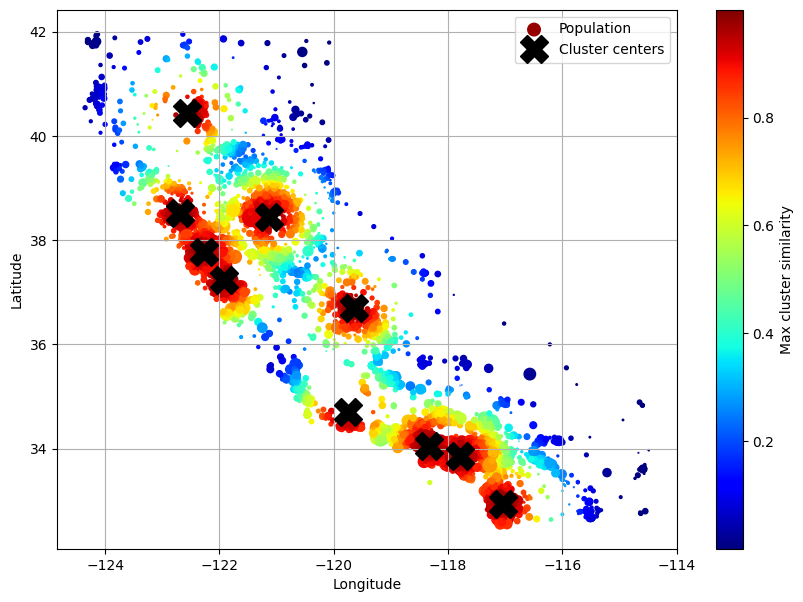
1.3.5.5 Transformation Pipelines
Now let’s build a pipeline to preprocess the numerical attributes:
from sklearn.pipeline import Pipeline

num_pipeline = Pipeline([
    ("impute", SimpleImputer(strategy="median")),
    ("standardize", StandardScaler()),
])
num_pipeline
Pipeline(steps=[('impute', SimpleImputer(strategy='median')),
('standardize', StandardScaler())])In a Jupyter environment, please rerun this cell to show the HTML representation or trust the notebook. On GitHub, the HTML representation is unable to render, please try loading this page with nbviewer.org.
Parameters
| steps | [('impute', ...), ('standardize', ...)] | |
| transform_input | None | |
| memory | None | |
| verbose | False |
Parameters
| missing_values | nan | |
| strategy | 'median' | |
| fill_value | None | |
| copy | True | |
| add_indicator | False | |
| keep_empty_features | False |
Parameters
| copy | True | |
| with_mean | True | |
| with_std | True |
from sklearn.pipeline import make_pipeline

num_pipeline = make_pipeline(SimpleImputer(strategy="median"), StandardScaler())
num_pipeline
Pipeline(steps=[('simpleimputer', SimpleImputer(strategy='median')),
('standardscaler', StandardScaler())])In a Jupyter environment, please rerun this cell to show the HTML representation or trust the notebook. On GitHub, the HTML representation is unable to render, please try loading this page with nbviewer.org.
Parameters
| steps | [('simpleimputer', ...), ('standardscaler', ...)] | |
| transform_input | None | |
| memory | None | |
| verbose | False |
Parameters
| missing_values | nan | |
| strategy | 'median' | |
| fill_value | None | |
| copy | True | |
| add_indicator | False | |
| keep_empty_features | False |
Parameters
| copy | True | |
| with_mean | True | |
| with_std | True |
Let’s call the pipeline’s fit_transform() method and look at the output’s first five rows, rounded to two decimal places:
housing_num_prepared = num_pipeline.fit_transform(housing_num)
housing_num_prepared[:5].round(2)
array([[-1.42, 1.01, 1.86, 0.31, 1.37, 0.14, 1.39, -0.94],
[ 0.6 , -0.7 , 0.91, -0.31, -0.44, -0.69, -0.37, 1.17],
[-1.2 , 1.28, 0.35, -0.71, -0.76, -0.79, -0.78, -0.76],
[ 1.23, -0.88, -0.92, 0.7 , 0.74, 0.38, 0.73, -0.85],
[ 0.71, -0.88, 0.59, 0.79, 1.6 , 0.44, 1.76, -0.18]])df_housing_num_prepared = pd.DataFrame(
housing_num_prepared, columns=num_pipeline.get_feature_names_out(),
index=housing_num.index)
df_housing_num_prepared.head()| longitude | latitude | housing_median_age | total_rooms | total_bedrooms | population | households | median_income | |
|---|---|---|---|---|---|---|---|---|
| 13096 | -1.423037 | 1.013606 | 1.861119 | 0.311912 | 1.368167 | 0.137460 | 1.394812 | -0.936491 |
| 14973 | 0.596394 | -0.702103 | 0.907630 | -0.308620 | -0.435925 | -0.693771 | -0.373485 | 1.171942 |
| 3785 | -1.203098 | 1.276119 | 0.351428 | -0.712240 | -0.760709 | -0.788768 | -0.775727 | -0.759789 |
| 14689 | 1.231216 | -0.884924 | -0.919891 | 0.702262 | 0.742306 | 0.383175 | 0.731375 | -0.850281 |
| 20507 | 0.711362 | -0.875549 | 0.589800 | 0.790125 | 1.595753 | 0.444376 | 1.755263 | -0.180365 |
num_pipeline.steps[('simpleimputer', SimpleImputer(strategy='median')),
('standardscaler', StandardScaler())]num_pipeline[1]StandardScaler()In a Jupyter environment, please rerun this cell to show the HTML representation or trust the notebook.
On GitHub, the HTML representation is unable to render, please try loading this page with nbviewer.org.
Parameters
| copy | True | |
| with_mean | True | |
| with_std | True |
num_pipeline[:-1]Pipeline(steps=[('simpleimputer', SimpleImputer(strategy='median'))])In a Jupyter environment, please rerun this cell to show the HTML representation or trust the notebook. On GitHub, the HTML representation is unable to render, please try loading this page with nbviewer.org.
Parameters
| steps | [('simpleimputer', ...)] | |
| transform_input | None | |
| memory | None | |
| verbose | False |
Parameters
| missing_values | nan | |
| strategy | 'median' | |
| fill_value | None | |
| copy | True | |
| add_indicator | False | |
| keep_empty_features | False |
num_pipeline.named_steps["simpleimputer"]SimpleImputer(strategy='median')In a Jupyter environment, please rerun this cell to show the HTML representation or trust the notebook.
On GitHub, the HTML representation is unable to render, please try loading this page with nbviewer.org.
Parameters
| missing_values | nan | |
| strategy | 'median' | |
| fill_value | None | |
| copy | True | |
| add_indicator | False | |
| keep_empty_features | False |
num_pipeline.set_params(simpleimputer__strategy="median")Pipeline(steps=[('simpleimputer', SimpleImputer(strategy='median')),
('standardscaler', StandardScaler())])In a Jupyter environment, please rerun this cell to show the HTML representation or trust the notebook. On GitHub, the HTML representation is unable to render, please try loading this page with nbviewer.org.
Parameters
| steps | [('simpleimputer', ...), ('standardscaler', ...)] | |
| transform_input | None | |
| memory | None | |
| verbose | False |
Parameters
| missing_values | nan | |
| strategy | 'median' | |
| fill_value | None | |
| copy | True | |
| add_indicator | False | |
| keep_empty_features | False |
Parameters
| copy | True | |
| with_mean | True | |
| with_std | True |
So far, we have handled the categorical columns and the numerical columns separately. It would be more convenient to have a single transformer capable of handling all columns, applying the appropriate transformations to each column. For this, you can use a ColumnTransformer. For example, the following ColumnTransformer will apply num_pipeline (the one we just defined) to the numerical attributes, and cat_pipeline to the categorical attribute:
from sklearn.compose import ColumnTransformer

num_attribs = ["longitude", "latitude", "housing_median_age", "total_rooms",
               "total_bedrooms", "population", "households", "median_income"]
cat_attribs = ["ocean_proximity"]

cat_pipeline = make_pipeline(
    SimpleImputer(strategy="most_frequent"),
    OneHotEncoder(handle_unknown="ignore"))

preprocessing = ColumnTransformer([
    ("num", num_pipeline, num_attribs),
    ("cat", cat_pipeline, cat_attribs),
])
Since listing all the column names is not very convenient, Scikit-Learn provides a make_column_selector class that you can use to automatically select all the features of a given type, such as numerical or categorical. You can pass a selector to the ColumnTransformer instead of column names or indices. Moreover, if you don’t care about naming the transformers, you can use make_column_transformer(), which chooses the names for you, just like make_pipeline() does. For example, the following code creates the same ColumnTransformer as earlier, except the transformers are automatically named "pipeline-1" and "pipeline-2" instead of "num" and "cat":
from sklearn.compose import make_column_selector, make_column_transformer

preprocessing = make_column_transformer(
    (num_pipeline, make_column_selector(dtype_include=np.number)),
    (cat_pipeline, make_column_selector(dtype_include=object)),
)
housing_prepared = preprocessing.fit_transform(housing)housing_prepared_fr = pd.DataFrame(
housing_prepared,
columns=preprocessing.get_feature_names_out(),
index=housing.index)
housing_prepared_fr.head()| pipeline-1__longitude | pipeline-1__latitude | pipeline-1__housing_median_age | pipeline-1__total_rooms | pipeline-1__total_bedrooms | pipeline-1__population | pipeline-1__households | pipeline-1__median_income | pipeline-2__ocean_proximity_<1H OCEAN | pipeline-2__ocean_proximity_INLAND | pipeline-2__ocean_proximity_ISLAND | pipeline-2__ocean_proximity_NEAR BAY | pipeline-2__ocean_proximity_NEAR OCEAN | |
|---|---|---|---|---|---|---|---|---|---|---|---|---|---|
| 13096 | -1.423037 | 1.013606 | 1.861119 | 0.311912 | 1.368167 | 0.137460 | 1.394812 | -0.936491 | 0.0 | 0.0 | 0.0 | 1.0 | 0.0 |
| 14973 | 0.596394 | -0.702103 | 0.907630 | -0.308620 | -0.435925 | -0.693771 | -0.373485 | 1.171942 | 1.0 | 0.0 | 0.0 | 0.0 | 0.0 |
| 3785 | -1.203098 | 1.276119 | 0.351428 | -0.712240 | -0.760709 | -0.788768 | -0.775727 | -0.759789 | 0.0 | 1.0 | 0.0 | 0.0 | 0.0 |
| 14689 | 1.231216 | -0.884924 | -0.919891 | 0.702262 | 0.742306 | 0.383175 | 0.731375 | -0.850281 | 0.0 | 1.0 | 0.0 | 0.0 | 0.0 |
| 20507 | 0.711362 | -0.875549 | 0.589800 | 0.790125 | 1.595753 | 0.444376 | 1.755263 | -0.180365 | 0.0 | 0.0 | 0.0 | 0.0 | 1.0 |
You now want to create a single pipeline that will perform all the transformations we’ve experimented with up to now. Let’s recap what the pipeline will do and why:
Missing values in numerical features will be imputed by replacing them with the median, as most ML algorithms don’t expect missing values. In categorical features, missing values will be replaced by the most frequent category.
The categorical feature will be one-hot encoded, as most ML algorithms only accept numerical inputs.
A few ratio features will be computed and added:
bedrooms_ratio,rooms_per_house, andpeople_per_house. Hopefully these will better correlate with the median house value, and thereby help the ML models.A few cluster similarity features will also be added. These will likely be more useful to the model than latitude and longitude.
Features with a long tail will be replaced by their logarithm, as most models prefer features with roughly uniform or Gaussian distributions.
All numerical features will be standardized, as most ML algorithms prefer when all features have roughly the same scale.
The code that builds the pipeline to do all of this should look familiar to you by now:
def column_ratio(X):
    return X[:, [0]] / X[:, [1]]

def ratio_name(function_transformer, feature_names_in):
    return ["ratio"]  # feature names out

def ratio_pipeline():
    return make_pipeline(
        SimpleImputer(strategy="median"),
        FunctionTransformer(column_ratio, feature_names_out=ratio_name),
        StandardScaler())

log_pipeline = make_pipeline(
    SimpleImputer(strategy="median"),
    FunctionTransformer(np.log, feature_names_out="one-to-one"),
    StandardScaler())

cluster_simil = ClusterSimilarity(n_clusters=10, gamma=1., random_state=42)

default_num_pipeline = make_pipeline(SimpleImputer(strategy="median"),
                                     StandardScaler())

preprocessing = ColumnTransformer([
        ("bedrooms", ratio_pipeline(), ["total_bedrooms", "total_rooms"]),
        ("rooms_per_house", ratio_pipeline(), ["total_rooms", "households"]),
        ("people_per_house", ratio_pipeline(), ["population", "households"]),
        ("log", log_pipeline, ["total_bedrooms", "total_rooms", "population", "households", "median_income"]),
        ("geo", cluster_simil, ["latitude", "longitude"]),
        ("cat", cat_pipeline, make_column_selector(dtype_include=object)),
    ],
    remainder=default_num_pipeline)  # one column remaining: housing_median_age
housing_prepared = preprocessing.fit_transform(housing)
housing_prepared.shape(16512, 24)preprocessing.get_feature_names_out()array(['bedrooms__ratio', 'rooms_per_house__ratio',
'people_per_house__ratio', 'log__total_bedrooms',
'log__total_rooms', 'log__population', 'log__households',
'log__median_income', 'geo__Cluster 0 similarity',
'geo__Cluster 1 similarity', 'geo__Cluster 2 similarity',
'geo__Cluster 3 similarity', 'geo__Cluster 4 similarity',
'geo__Cluster 5 similarity', 'geo__Cluster 6 similarity',
'geo__Cluster 7 similarity', 'geo__Cluster 8 similarity',
'geo__Cluster 9 similarity', 'cat__ocean_proximity_<1H OCEAN',
'cat__ocean_proximity_INLAND', 'cat__ocean_proximity_ISLAND',
'cat__ocean_proximity_NEAR BAY', 'cat__ocean_proximity_NEAR OCEAN',
'remainder__housing_median_age'], dtype=object)housing_prepared_fr = pd.DataFrame(
housing_prepared,
columns=preprocessing.get_feature_names_out(),
index=housing.index)
housing_prepared_fr.head()| bedrooms__ratio | rooms_per_house__ratio | people_per_house__ratio | log__total_bedrooms | log__total_rooms | log__population | log__households | log__median_income | geo__Cluster 0 similarity | geo__Cluster 1 similarity | ... | geo__Cluster 6 similarity | geo__Cluster 7 similarity | geo__Cluster 8 similarity | geo__Cluster 9 similarity | cat__ocean_proximity_<1H OCEAN | cat__ocean_proximity_INLAND | cat__ocean_proximity_ISLAND | cat__ocean_proximity_NEAR BAY | cat__ocean_proximity_NEAR OCEAN | remainder__housing_median_age | |
|---|---|---|---|---|---|---|---|---|---|---|---|---|---|---|---|---|---|---|---|---|---|
| 13096 | 1.846624 | -0.866027 | -0.330204 | 1.324114 | 0.637892 | 0.456906 | 1.310369 | -1.071522 | 4.581829e-01 | 1.241847e-14 | ... | 8.489216e-04 | 9.770322e-01 | 2.382191e-08 | 3.819126e-18 | 0.0 | 0.0 | 0.0 | 1.0 | 0.0 | 1.861119 |
| 14973 | -0.508121 | 0.024550 | -0.253616 | -0.252671 | -0.063576 | -0.711654 | -0.142030 | 1.194712 | 6.511495e-10 | 9.579596e-01 | ... | 5.614049e-27 | 1.260964e-13 | 1.103491e-01 | 3.547610e-01 | 1.0 | 0.0 | 0.0 | 0.0 | 0.0 | 0.907630 |
| 3785 | -0.202155 | -0.041193 | -0.051041 | -0.925266 | -0.859927 | -0.941997 | -0.913030 | -0.756981 | 3.432506e-01 | 4.261141e-15 | ... | 5.641131e-03 | 7.303265e-01 | 2.508224e-08 | 2.669659e-18 | 0.0 | 1.0 | 0.0 | 0.0 | 0.0 | 0.351428 |
| 14689 | -0.149006 | -0.034858 | -0.141475 | 0.952773 | 0.943475 | 0.670700 | 0.925373 | -0.912253 | 2.244844e-15 | 2.704823e-01 | ... | 5.913326e-35 | 5.201263e-20 | 1.712982e-03 | 8.874598e-01 | 0.0 | 1.0 | 0.0 | 0.0 | 0.0 | -0.919891 |
| 20507 | 0.963208 | -0.666554 | -0.306148 | 1.437622 | 1.003590 | 0.719093 | 1.481464 | 0.034537 | 1.090228e-11 | 9.422206e-01 | ... | 5.421817e-30 | 1.048030e-15 | 2.568824e-02 | 5.279506e-01 | 0.0 | 0.0 | 0.0 | 0.0 | 1.0 | 0.589800 |
5 rows × 24 columns
1.3.6 Select and Train a Model
1.3.6.1 Train and Evaluate on the Training Set
You decide to train a very basic linear regression model to get started:
from sklearn.linear_model import LinearRegression

lin_reg = make_pipeline(preprocessing, LinearRegression())
lin_reg.fit(housing, housing_labels)
Pipeline(steps=[('columntransformer',
ColumnTransformer(remainder=Pipeline(steps=[('simpleimputer',
SimpleImputer(strategy='median')),
('standardscaler',
StandardScaler())]),
transformers=[('bedrooms',
Pipeline(steps=[('simpleimputer',
SimpleImputer(strategy='median')),
('functiontransformer',
FunctionTransformer(feature_names_out=<function ratio_name at 0x000...
'median_income']),
('geo',
ClusterSimilarity(random_state=42),
['latitude', 'longitude']),
('cat',
Pipeline(steps=[('simpleimputer',
SimpleImputer(strategy='most_frequent')),
('onehotencoder',
OneHotEncoder(handle_unknown='ignore'))]),
<sklearn.compose._column_transformer.make_column_selector object at 0x0000025BFC265E50>)])),
('linearregression', LinearRegression())])In a Jupyter environment, please rerun this cell to show the HTML representation or trust the notebook. On GitHub, the HTML representation is unable to render, please try loading this page with nbviewer.org.
Parameters
| steps | [('columntransformer', ...), ('linearregression', ...)] | |
| transform_input | None | |
| memory | None | |
| verbose | False |
Parameters
| transformers | [('bedrooms', ...), ('rooms_per_house', ...), ...] | |
| remainder | Pipeline(step...ardScaler())]) | |
| sparse_threshold | 0.3 | |
| n_jobs | None | |
| transformer_weights | None | |
| verbose | False | |
| verbose_feature_names_out | True | |
| force_int_remainder_cols | 'deprecated' |
['total_bedrooms', 'total_rooms']
Parameters
| missing_values | nan | |
| strategy | 'median' | |
| fill_value | None | |
| copy | True | |
| add_indicator | False | |
| keep_empty_features | False |
Parameters
| func | <function col...0025BF9C1CA40> | |
| inverse_func | None | |
| validate | False | |
| accept_sparse | False | |
| check_inverse | True | |
| feature_names_out | <function rat...0025BF9C1CB80> | |
| kw_args | None | |
| inv_kw_args | None |
Parameters
| copy | True | |
| with_mean | True | |
| with_std | True |
['total_rooms', 'households']
Parameters
| missing_values | nan | |
| strategy | 'median' | |
| fill_value | None | |
| copy | True | |
| add_indicator | False | |
| keep_empty_features | False |
Parameters
| func | <function col...0025BF9C1CA40> | |
| inverse_func | None | |
| validate | False | |
| accept_sparse | False | |
| check_inverse | True | |
| feature_names_out | <function rat...0025BF9C1CB80> | |
| kw_args | None | |
| inv_kw_args | None |
Parameters
| copy | True | |
| with_mean | True | |
| with_std | True |
['population', 'households']
Parameters
| missing_values | nan | |
| strategy | 'median' | |
| fill_value | None | |
| copy | True | |
| add_indicator | False | |
| keep_empty_features | False |
Parameters
| func | <function col...0025BF9C1CA40> | |
| inverse_func | None | |
| validate | False | |
| accept_sparse | False | |
| check_inverse | True | |
| feature_names_out | <function rat...0025BF9C1CB80> | |
| kw_args | None | |
| inv_kw_args | None |
Parameters
| copy | True | |
| with_mean | True | |
| with_std | True |
['total_bedrooms', 'total_rooms', 'population', 'households', 'median_income']
Parameters
| missing_values | nan | |
| strategy | 'median' | |
| fill_value | None | |
| copy | True | |
| add_indicator | False | |
| keep_empty_features | False |
Parameters
| func | <ufunc 'log'> | |
| inverse_func | None | |
| validate | False | |
| accept_sparse | False | |
| check_inverse | True | |
| feature_names_out | 'one-to-one' | |
| kw_args | None | |
| inv_kw_args | None |
Parameters
| copy | True | |
| with_mean | True | |
| with_std | True |
['latitude', 'longitude']
Parameters
| n_clusters | 10 | |
| gamma | 1.0 | |
| random_state | 42 |
<sklearn.compose._column_transformer.make_column_selector object at 0x0000025BFC265E50>
Parameters
| missing_values | nan | |
| strategy | 'most_frequent' | |
| fill_value | None | |
| copy | True | |
| add_indicator | False | |
| keep_empty_features | False |
Parameters
| categories | 'auto' | |
| drop | None | |
| sparse_output | True | |
| dtype | <class 'numpy.float64'> | |
| handle_unknown | 'ignore' | |
| min_frequency | None | |
| max_categories | None | |
| feature_name_combiner | 'concat' |
['housing_median_age']
Parameters
| missing_values | nan | |
| strategy | 'median' | |
| fill_value | None | |
| copy | True | |
| add_indicator | False | |
| keep_empty_features | False |
Parameters
| copy | True | |
| with_mean | True | |
| with_std | True |
Parameters
| fit_intercept | True | |
| copy_X | True | |
| tol | 1e-06 | |
| n_jobs | None | |
| positive | False |
housing_predictions = lin_reg.predict(housing)
housing_predictions[:5].round(-2)  # -2 = rounded to the nearest hundred
array([246000., 372700., 135700., 91400., 330900.])housing_labels.iloc[:5].valuesarray([458300., 483800., 101700., 96100., 361800.])Well, it works, but not always: the first prediction is way off (by over $ 200,000!), while the other predictions are better: two are off by about 25%, and two are off by less than 10%. Remember that you chose to use the RMSE as your performance measure, so you want to measure this regression model’s RMSE on the whole training set using Scikit-Learn’s root_mean_squared_error() function:
from sklearn.metrics import root_mean_squared_error
lin_rmse = root_mean_squared_error(housing_labels, housing_predictions)
lin_rmse68972.88910758478This is better than nothing, but clearly not a great score: the median_housing_values of most districts range between $120,000 and $265,000, so a typical prediction error of $68,973 is really not very satisfying. This is an example of a model underfitting the training data. When this happens it can mean that the features do not provide enough information to make good predictions, or that the model is not powerful enough. As we saw in the previous chapter, the main ways to fix underfitting are to select a more powerful model, to feed the training algorithm with better features, or to reduce the constraints on the model. This model is not regularized, which rules out the last option. You could try to add more features, but first you want to try a more complex model to see how it does.
You decide to try a DecisionTreeRegressor, as this is a fairly powerful model capable of finding complex nonlinear relationships in the data
from sklearn.tree import DecisionTreeRegressor

tree_reg = make_pipeline(preprocessing, DecisionTreeRegressor(random_state=42))
tree_reg.fit(housing, housing_labels)
Pipeline(steps=[('columntransformer',
ColumnTransformer(remainder=Pipeline(steps=[('simpleimputer',
SimpleImputer(strategy='median')),
('standardscaler',
StandardScaler())]),
transformers=[('bedrooms',
Pipeline(steps=[('simpleimputer',
SimpleImputer(strategy='median')),
('functiontransformer',
FunctionTransformer(feature_names_out=<function ratio_name at 0x000...
ClusterSimilarity(random_state=42),
['latitude', 'longitude']),
('cat',
Pipeline(steps=[('simpleimputer',
SimpleImputer(strategy='most_frequent')),
('onehotencoder',
OneHotEncoder(handle_unknown='ignore'))]),
<sklearn.compose._column_transformer.make_column_selector object at 0x0000025BFC265E50>)])),
('decisiontreeregressor',
DecisionTreeRegressor(random_state=42))])In a Jupyter environment, please rerun this cell to show the HTML representation or trust the notebook. On GitHub, the HTML representation is unable to render, please try loading this page with nbviewer.org.
Parameters
| steps | [('columntransformer', ...), ('decisiontreeregressor', ...)] | |
| transform_input | None | |
| memory | None | |
| verbose | False |
Parameters
| transformers | [('bedrooms', ...), ('rooms_per_house', ...), ...] | |
| remainder | Pipeline(step...ardScaler())]) | |
| sparse_threshold | 0.3 | |
| n_jobs | None | |
| transformer_weights | None | |
| verbose | False | |
| verbose_feature_names_out | True | |
| force_int_remainder_cols | 'deprecated' |
['total_bedrooms', 'total_rooms']
Parameters
| missing_values | nan | |
| strategy | 'median' | |
| fill_value | None | |
| copy | True | |
| add_indicator | False | |
| keep_empty_features | False |
Parameters
| func | <function col...0025BF9C1CA40> | |
| inverse_func | None | |
| validate | False | |
| accept_sparse | False | |
| check_inverse | True | |
| feature_names_out | <function rat...0025BF9C1CB80> | |
| kw_args | None | |
| inv_kw_args | None |
Parameters
| copy | True | |
| with_mean | True | |
| with_std | True |
['total_rooms', 'households']
Parameters
| missing_values | nan | |
| strategy | 'median' | |
| fill_value | None | |
| copy | True | |
| add_indicator | False | |
| keep_empty_features | False |
Parameters
| func | <function col...0025BF9C1CA40> | |
| inverse_func | None | |
| validate | False | |
| accept_sparse | False | |
| check_inverse | True | |
| feature_names_out | <function rat...0025BF9C1CB80> | |
| kw_args | None | |
| inv_kw_args | None |
Parameters
| copy | True | |
| with_mean | True | |
| with_std | True |
['population', 'households']
Parameters
| missing_values | nan | |
| strategy | 'median' | |
| fill_value | None | |
| copy | True | |
| add_indicator | False | |
| keep_empty_features | False |
Parameters
| func | <function col...0025BF9C1CA40> | |
| inverse_func | None | |
| validate | False | |
| accept_sparse | False | |
| check_inverse | True | |
| feature_names_out | <function rat...0025BF9C1CB80> | |
| kw_args | None | |
| inv_kw_args | None |
Parameters
| copy | True | |
| with_mean | True | |
| with_std | True |
['total_bedrooms', 'total_rooms', 'population', 'households', 'median_income']
Parameters
| missing_values | nan | |
| strategy | 'median' | |
| fill_value | None | |
| copy | True | |
| add_indicator | False | |
| keep_empty_features | False |
Parameters
| func | <ufunc 'log'> | |
| inverse_func | None | |
| validate | False | |
| accept_sparse | False | |
| check_inverse | True | |
| feature_names_out | 'one-to-one' | |
| kw_args | None | |
| inv_kw_args | None |
Parameters
| copy | True | |
| with_mean | True | |
| with_std | True |
['latitude', 'longitude']
Parameters
| n_clusters | 10 | |
| gamma | 1.0 | |
| random_state | 42 |
<sklearn.compose._column_transformer.make_column_selector object at 0x0000025BFC265E50>
Parameters
| missing_values | nan | |
| strategy | 'most_frequent' | |
| fill_value | None | |
| copy | True | |
| add_indicator | False | |
| keep_empty_features | False |
Parameters
| categories | 'auto' | |
| drop | None | |
| sparse_output | True | |
| dtype | <class 'numpy.float64'> | |
| handle_unknown | 'ignore' | |
| min_frequency | None | |
| max_categories | None | |
| feature_name_combiner | 'concat' |
['housing_median_age']
Parameters
| missing_values | nan | |
| strategy | 'median' | |
| fill_value | None | |
| copy | True | |
| add_indicator | False | |
| keep_empty_features | False |
Parameters
| copy | True | |
| with_mean | True | |
| with_std | True |
Parameters
| criterion | 'squared_error' | |
| splitter | 'best' | |
| max_depth | None | |
| min_samples_split | 2 | |
| min_samples_leaf | 1 | |
| min_weight_fraction_leaf | 0.0 | |
| max_features | None | |
| random_state | 42 | |
| max_leaf_nodes | None | |
| min_impurity_decrease | 0.0 | |
| ccp_alpha | 0.0 | |
| monotonic_cst | None |
housing_predictions = tree_reg.predict(housing)
tree_rmse = root_mean_squared_error(housing_labels, housing_predictions)
tree_rmse0.0Wait, what!? No error at all? Could this model really be absolutely perfect? Of course, it is much more likely that the model has badly overfit the data. How can you be sure? As you saw earlier, you don’t want to touch the test set until you are ready to launch a model you are confident about, so you need to use part of the training set for training and part of it for model validation.
1.3.6.2 Better Evaluation Using Cross-Validation
One way to evaluate the decision tree model would be to use the train_test_split() function to split the training set into a smaller training set and a validation set, then train your models against the smaller training set and evaluate them against the validation set. It’s a bit of effort, but nothing too difficult, and it would work fairly well.
A great alternative is to use Scikit-Learn’s k-fold cross-validation feature. You split the training set into k nonoverlapping subsets called folds, then you train and evaluate your model k times, picking a different fold for evaluation every time (i.e., the validation fold) and using the other k – 1 folds for training. This process produces k evaluation scores.

Scikit-Learn provides a convenient cross_val_score() function that does just that, and it returns an array containing the k evaluation scores. For example, let’s use it to evaluate our tree regressor, using \(k\) = 10:
from sklearn.model_selection import cross_val_score

tree_rmses = -cross_val_score(tree_reg, housing, housing_labels,
                              scoring="neg_root_mean_squared_error", cv=10)
pd.Series(tree_rmses).describe()
count 10.000000
mean 66573.734600
std 1103.402323
min 64607.896046
25% 66204.731788
50% 66388.272499
75% 66826.257468
max 68532.210664
dtype: float64Now the decision tree doesn’t look as good as it did earlier. In fact, it seems to perform almost as poorly as the linear regression model! Notice that cross-validation allows you to get not only an estimate of the performance of your model, but also a measure of how precise this estimate is (i.e., its standard deviation). The decision tree has an RMSE of about 66,573, with a standard deviation of about 1,103. You would not have this information if you just used one validation set. But cross-validation comes at the cost of training the model several times, so it is not always feasible.
If you compute the same metric for the linear regression model, you will find that the mean RMSE is 70,003 and the standard deviation is 4,182. So the decision tree model seems to perform very slightly better than the linear model, but the difference is minimal due to severe overfitting. We know there’s an overfitting problem because the training error is low (actually zero) while the validation error is high.
Let’s try one last model now: the RandomForestRegressor. Random forests work by training many decision trees on random subsets of the features, then averaging out their predictions. Such models composed of many other models are called ensembles: if the underlying models are very diverse, then their errors will not be very correlated, and therefore averaging out the predictions will smooth out the errors, reduce overfitting, and improve the overall performance. The code is much the same as earlier:
from sklearn.ensemble import RandomForestRegressor

forest_reg = make_pipeline(preprocessing,
                           RandomForestRegressor(random_state=42))
forest_rmses = -cross_val_score(forest_reg, housing, housing_labels,
                                scoring="neg_root_mean_squared_error", cv=10)
pd.Series(forest_rmses).describe()
count 10.000000
mean 47038.092799
std 1021.491757
min 45495.976649
25% 46510.418013
50% 47118.719249
75% 47480.519175
max 49140.832210
dtype: float64Wow, this is much better: random forests really look very promising for this task! However, if you train a RandomForestRegressor and measure the RMSE on the training set, you will find roughly 17,551: that’s much lower, meaning that there’s still quite a lot of overfitting going on. Possible solutions are to simplify the model, constrain it (i.e., regularize it), or get a lot more training data. Before you dive much deeper into random forests, however, you should try out many other models from various categories of machine learning algorithms (e.g., several support vector machines with different kernels, and possibly a neural network), without spending too much time tweaking the hyperparameters. The goal is to shortlist a few (two to five) promising models.
1.3.7 Fine-Tune Your Model
1.3.7.1 Grid Search
One option would be to fiddle with the hyperparameters manually, until you find a great combination of hyperparameter values. This would be very tedious work, and you may not have time to explore many combinations.
Instead, you can use Scikit-Learn’s GridSearchCV class to search for you. All you need to do is tell it which hyperparameters you want it to experiment with and what values to try out, and it will use cross-validation to evaluate all the possible combinations of hyperparameter values. For example, the following code searches for the best combination of hyperparameter values for the RandomForestRegressor:
from sklearn.model_selection import GridSearchCV

full_pipeline = Pipeline([
    ("preprocessing", preprocessing),
    ("random_forest", RandomForestRegressor(random_state=42)),
])
param_grid = [
    {'preprocessing__geo__n_clusters': [5, 8, 10],
     'random_forest__max_features': [4, 6, 8]},
    {'preprocessing__geo__n_clusters': [10, 15],
     'random_forest__max_features': [6, 8, 10]},
]
grid_search = GridSearchCV(full_pipeline, param_grid, cv=3,
                           scoring='neg_root_mean_squared_error')
grid_search.fit(housing, housing_labels)
GridSearchCV(cv=3,
estimator=Pipeline(steps=[('preprocessing',
ColumnTransformer(remainder=Pipeline(steps=[('simpleimputer',
SimpleImputer(strategy='median')),
('standardscaler',
StandardScaler())]),
transformers=[('bedrooms',
Pipeline(steps=[('simpleimputer',
SimpleImputer(strategy='median')),
('functiontransformer',
FunctionTransformer(feature_names_out=<f...
<sklearn.compose._column_transformer.make_column_selector object at 0x0000025BFC265E50>)])),
('random_forest',
RandomForestRegressor(random_state=42))]),
param_grid=[{'preprocessing__geo__n_clusters': [5, 8, 10],
'random_forest__max_features': [4, 6, 8]},
{'preprocessing__geo__n_clusters': [10, 15],
'random_forest__max_features': [6, 8, 10]}],
scoring='neg_root_mean_squared_error')In a Jupyter environment, please rerun this cell to show the HTML representation or trust the notebook. On GitHub, the HTML representation is unable to render, please try loading this page with nbviewer.org.
Parameters
| estimator | Pipeline(step...m_state=42))]) | |
| param_grid | [{'preprocessing__geo__n_clusters': [5, 8, ...], 'random_forest__max_features': [4, 6, ...]}, {'preprocessing__geo__n_clusters': [10, 15], 'random_forest__max_features': [6, 8, ...]}] | |
| scoring | 'neg_root_mean_squared_error' | |
| n_jobs | None | |
| refit | True | |
| cv | 3 | |
| verbose | 0 | |
| pre_dispatch | '2*n_jobs' | |
| error_score | nan | |
| return_train_score | False |
Parameters
| transformers | [('bedrooms', ...), ('rooms_per_house', ...), ...] | |
| remainder | Pipeline(step...ardScaler())]) | |
| sparse_threshold | 0.3 | |
| n_jobs | None | |
| transformer_weights | None | |
| verbose | False | |
| verbose_feature_names_out | True | |
| force_int_remainder_cols | 'deprecated' |
['total_bedrooms', 'total_rooms']
Parameters
| missing_values | nan | |
| strategy | 'median' | |
| fill_value | None | |
| copy | True | |
| add_indicator | False | |
| keep_empty_features | False |
Parameters
| func | <function col...0025BF9C1CA40> | |
| inverse_func | None | |
| validate | False | |
| accept_sparse | False | |
| check_inverse | True | |
| feature_names_out | <function rat...0025BF9C1CB80> | |
| kw_args | None | |
| inv_kw_args | None |
Parameters
| copy | True | |
| with_mean | True | |
| with_std | True |
['total_rooms', 'households']
Parameters
| missing_values | nan | |
| strategy | 'median' | |
| fill_value | None | |
| copy | True | |
| add_indicator | False | |
| keep_empty_features | False |
Parameters
| func | <function col...0025BF9C1CA40> | |
| inverse_func | None | |
| validate | False | |
| accept_sparse | False | |
| check_inverse | True | |
| feature_names_out | <function rat...0025BF9C1CB80> | |
| kw_args | None | |
| inv_kw_args | None |
Parameters
| copy | True | |
| with_mean | True | |
| with_std | True |
['population', 'households']
Parameters
| missing_values | nan | |
| strategy | 'median' | |
| fill_value | None | |
| copy | True | |
| add_indicator | False | |
| keep_empty_features | False |
Parameters
| func | <function col...0025BF9C1CA40> | |
| inverse_func | None | |
| validate | False | |
| accept_sparse | False | |
| check_inverse | True | |
| feature_names_out | <function rat...0025BF9C1CB80> | |
| kw_args | None | |
| inv_kw_args | None |
Parameters
| copy | True | |
| with_mean | True | |
| with_std | True |
['total_bedrooms', 'total_rooms', 'population', 'households', 'median_income']
Parameters
| missing_values | nan | |
| strategy | 'median' | |
| fill_value | None | |
| copy | True | |
| add_indicator | False | |
| keep_empty_features | False |
Parameters
| func | <ufunc 'log'> | |
| inverse_func | None | |
| validate | False | |
| accept_sparse | False | |
| check_inverse | True | |
| feature_names_out | 'one-to-one' | |
| kw_args | None | |
| inv_kw_args | None |
Parameters
| copy | True | |
| with_mean | True | |
| with_std | True |
['latitude', 'longitude']
Parameters
| n_clusters | 15 | |
| gamma | 1.0 | |
| random_state | 42 |
<sklearn.compose._column_transformer.make_column_selector object at 0x0000025BFC2E8BF0>
Parameters
| missing_values | nan | |
| strategy | 'most_frequent' | |
| fill_value | None | |
| copy | True | |
| add_indicator | False | |
| keep_empty_features | False |
Parameters
| categories | 'auto' | |
| drop | None | |
| sparse_output | True | |
| dtype | <class 'numpy.float64'> | |
| handle_unknown | 'ignore' | |
| min_frequency | None | |
| max_categories | None | |
| feature_name_combiner | 'concat' |
['housing_median_age']
Parameters
| missing_values | nan | |
| strategy | 'median' | |
| fill_value | None | |
| copy | True | |
| add_indicator | False | |
| keep_empty_features | False |
Parameters
| copy | True | |
| with_mean | True | |
| with_std | True |
Parameters
| n_estimators | 100 | |
| criterion | 'squared_error' | |
| max_depth | None | |
| min_samples_split | 2 | |
| min_samples_leaf | 1 | |
| min_weight_fraction_leaf | 0.0 | |
| max_features | 6 | |
| max_leaf_nodes | None | |
| min_impurity_decrease | 0.0 | |
| bootstrap | True | |
| oob_score | False | |
| n_jobs | None | |
| random_state | 42 | |
| verbose | 0 | |
| warm_start | False | |
| ccp_alpha | 0.0 | |
| max_samples | None | |
| monotonic_cst | None |
Notice that you can refer to any hyperparameter of any estimator in a pipeline, even if this estimator is nested deep inside several pipelines and column transformers. For example, when Scikit-Learn sees “preprocessing__geo__n_clusters”, it splits this string at the double underscores, then it looks for an estimator named “preprocessing” in the pipeline and finds the preprocessing ColumnTransformer. Next, it looks for a transformer named “geo” inside this ColumnTransformer and finds the ClusterSimilarity transformer we used on the latitude and longitude attributes. Then it finds this transformer’s n_clusters hyperparameter. Similarly, random_forest__max_features refers to the max_features hyperparameter of the estimator named “random_forest”, which is of course the RandomForestRegressor model.
There are two dictionaries in this param_grid, so GridSearchCV will first evaluate all 3 × 3 = 9 combinations of n_clusters and max_features hyperparameter values specified in the first dict, then it will try all 2 × 3 = 6 combinations of hyperparameter values in the second dict. So in total the grid search will explore 9 + 6 = 15 combinations of hyperparameter values, and it will train the pipeline 3 times per combination, since we are using 3-fold cross validation. This means there will be a grand total of 15 × 3 = 45 rounds of training! It may take a while, but when it is done you can get the best combination of parameters like this:
grid_search.best_params_{'preprocessing__geo__n_clusters': 15, 'random_forest__max_features': 6}grid_search.best_estimator_Pipeline(steps=[('preprocessing',
ColumnTransformer(remainder=Pipeline(steps=[('simpleimputer',
SimpleImputer(strategy='median')),
('standardscaler',
StandardScaler())]),
transformers=[('bedrooms',
Pipeline(steps=[('simpleimputer',
SimpleImputer(strategy='median')),
('functiontransformer',
FunctionTransformer(feature_names_out=<function ratio_name at 0x0000025...
ClusterSimilarity(n_clusters=15,
random_state=42),
['latitude', 'longitude']),
('cat',
Pipeline(steps=[('simpleimputer',
SimpleImputer(strategy='most_frequent')),
('onehotencoder',
OneHotEncoder(handle_unknown='ignore'))]),
<sklearn.compose._column_transformer.make_column_selector object at 0x0000025BFC2E8BF0>)])),
('random_forest',
RandomForestRegressor(max_features=6, random_state=42))])In a Jupyter environment, please rerun this cell to show the HTML representation or trust the notebook. On GitHub, the HTML representation is unable to render, please try loading this page with nbviewer.org.
Parameters
| steps | [('preprocessing', ...), ('random_forest', ...)] | |
| transform_input | None | |
| memory | None | |
| verbose | False |
Parameters
| transformers | [('bedrooms', ...), ('rooms_per_house', ...), ...] | |
| remainder | Pipeline(step...ardScaler())]) | |
| sparse_threshold | 0.3 | |
| n_jobs | None | |
| transformer_weights | None | |
| verbose | False | |
| verbose_feature_names_out | True | |
| force_int_remainder_cols | 'deprecated' |
['total_bedrooms', 'total_rooms']
Parameters
| missing_values | nan | |
| strategy | 'median' | |
| fill_value | None | |
| copy | True | |
| add_indicator | False | |
| keep_empty_features | False |
Parameters
| func | <function col...0025BF9C1CA40> | |
| inverse_func | None | |
| validate | False | |
| accept_sparse | False | |
| check_inverse | True | |
| feature_names_out | <function rat...0025BF9C1CB80> | |
| kw_args | None | |
| inv_kw_args | None |
Parameters
| copy | True | |
| with_mean | True | |
| with_std | True |
['total_rooms', 'households']
Parameters
| missing_values | nan | |
| strategy | 'median' | |
| fill_value | None | |
| copy | True | |
| add_indicator | False | |
| keep_empty_features | False |
Parameters
| func | <function col...0025BF9C1CA40> | |
| inverse_func | None | |
| validate | False | |
| accept_sparse | False | |
| check_inverse | True | |
| feature_names_out | <function rat...0025BF9C1CB80> | |
| kw_args | None | |
| inv_kw_args | None |
Parameters
| copy | True | |
| with_mean | True | |
| with_std | True |
['population', 'households']
Parameters
| missing_values | nan | |
| strategy | 'median' | |
| fill_value | None | |
| copy | True | |
| add_indicator | False | |
| keep_empty_features | False |
Parameters
| func | <function col...0025BF9C1CA40> | |
| inverse_func | None | |
| validate | False | |
| accept_sparse | False | |
| check_inverse | True | |
| feature_names_out | <function rat...0025BF9C1CB80> | |
| kw_args | None | |
| inv_kw_args | None |
Parameters
| copy | True | |
| with_mean | True | |
| with_std | True |
['total_bedrooms', 'total_rooms', 'population', 'households', 'median_income']
Parameters
| missing_values | nan | |
| strategy | 'median' | |
| fill_value | None | |
| copy | True | |
| add_indicator | False | |
| keep_empty_features | False |
Parameters
| func | <ufunc 'log'> | |
| inverse_func | None | |
| validate | False | |
| accept_sparse | False | |
| check_inverse | True | |
| feature_names_out | 'one-to-one' | |
| kw_args | None | |
| inv_kw_args | None |
Parameters
| copy | True | |
| with_mean | True | |
| with_std | True |
['latitude', 'longitude']
Parameters
| n_clusters | 15 | |
| gamma | 1.0 | |
| random_state | 42 |
<sklearn.compose._column_transformer.make_column_selector object at 0x0000025BFC2E8BF0>
Parameters
| missing_values | nan | |
| strategy | 'most_frequent' | |
| fill_value | None | |
| copy | True | |
| add_indicator | False | |
| keep_empty_features | False |
Parameters
| categories | 'auto' | |
| drop | None | |
| sparse_output | True | |
| dtype | <class 'numpy.float64'> | |
| handle_unknown | 'ignore' | |
| min_frequency | None | |
| max_categories | None | |
| feature_name_combiner | 'concat' |
['housing_median_age']
Parameters
| missing_values | nan | |
| strategy | 'median' | |
| fill_value | None | |
| copy | True | |
| add_indicator | False | |
| keep_empty_features | False |
Parameters
| copy | True | |
| with_mean | True | |
| with_std | True |
Parameters
| n_estimators | 100 | |
| criterion | 'squared_error' | |
| max_depth | None | |
| min_samples_split | 2 | |
| min_samples_leaf | 1 | |
| min_weight_fraction_leaf | 0.0 | |
| max_features | 6 | |
| max_leaf_nodes | None | |
| min_impurity_decrease | 0.0 | |
| bootstrap | True | |
| oob_score | False | |
| n_jobs | None | |
| random_state | 42 | |
| verbose | 0 | |
| warm_start | False | |
| ccp_alpha | 0.0 | |
| max_samples | None | |
| monotonic_cst | None |
cv_res = pd.DataFrame(grid_search.cv_results_)
cv_res.sort_values(by="mean_test_score", ascending=False, inplace=True)

# extra code – these few lines of code just make the DataFrame look nicer
cv_res = cv_res[["param_preprocessing__geo__n_clusters",
                 "param_random_forest__max_features", "split0_test_score",
                 "split1_test_score", "split2_test_score", "mean_test_score"]]
score_cols = ["split0", "split1", "split2", "mean_test_rmse"]
cv_res.columns = ["n_clusters", "max_features"] + score_cols
cv_res[score_cols] = -cv_res[score_cols].round().astype(np.int64)

cv_res.head()| n_clusters | max_features | split0 | split1 | split2 | mean_test_rmse | |
|---|---|---|---|---|---|---|
| 12 | 15 | 6 | 42725 | 43708 | 44335 | 43590 |
| 13 | 15 | 8 | 43486 | 43820 | 44900 | 44069 |
| 6 | 10 | 4 | 43798 | 44036 | 44961 | 44265 |
| 9 | 10 | 6 | 43710 | 44163 | 44967 | 44280 |
| 7 | 10 | 6 | 43710 | 44163 | 44967 | 44280 |
The mean test RMSE score for the best model is 43,590, which is better than the score you got earlier using the default hyperparameter values (which was 47,038). Congratulations, you have successfully fine-tuned your best model!
1.3.7.2 Randomized Search
The grid search approach is fine when you are exploring relatively few combinations, like in the previous example, but RandomizedSearchCV is often preferable, especially when the hyperparameter search space is large. This class can be used in much the same way as the GridSearchCV class, but instead of trying out all possible combinations it evaluates a fixed number of combinations, selecting a random value for each hyperparameter at every iteration.
For each hyperparameter, you must provide either a list of possible values, or a probability distribution:
from sklearn.model_selection import RandomizedSearchCV
from scipy.stats import randint

param_distribs = {'preprocessing__geo__n_clusters': randint(low=3, high=50),
                  'random_forest__max_features': randint(low=2, high=20)}

rnd_search = RandomizedSearchCV(
    full_pipeline, param_distributions=param_distribs, n_iter=10, cv=3,
    scoring='neg_root_mean_squared_error', random_state=42)

rnd_search.fit(housing, housing_labels)
RandomizedSearchCV(cv=3,
estimator=Pipeline(steps=[('preprocessing',
ColumnTransformer(remainder=Pipeline(steps=[('simpleimputer',
SimpleImputer(strategy='median')),
('standardscaler',
StandardScaler())]),
transformers=[('bedrooms',
Pipeline(steps=[('simpleimputer',
SimpleImputer(strategy='median')),
('functiontransformer',
FunctionTransformer(feature_names_...
('random_forest',
RandomForestRegressor(random_state=42))]),
param_distributions={'preprocessing__geo__n_clusters': <scipy.stats._distn_infrastructure.rv_discrete_frozen object at 0x0000025B96C7D550>,
'random_forest__max_features': <scipy.stats._distn_infrastructure.rv_discrete_frozen object at 0x0000025BFC266AD0>},
random_state=42, scoring='neg_root_mean_squared_error')In a Jupyter environment, please rerun this cell to show the HTML representation or trust the notebook. On GitHub, the HTML representation is unable to render, please try loading this page with nbviewer.org.
Parameters
| estimator | Pipeline(step...m_state=42))]) | |
| param_distributions | {'preprocessing__geo__n_clusters': <scipy.stats....0025B96C7D550>, 'random_forest__max_features': <scipy.stats....0025BFC266AD0>} | |
| n_iter | 10 | |
| scoring | 'neg_root_mean_squared_error' | |
| n_jobs | None | |
| refit | True | |
| cv | 3 | |
| verbose | 0 | |
| pre_dispatch | '2*n_jobs' | |
| random_state | 42 | |
| error_score | nan | |
| return_train_score | False |
Parameters
| transformers | [('bedrooms', ...), ('rooms_per_house', ...), ...] | |
| remainder | Pipeline(step...ardScaler())]) | |
| sparse_threshold | 0.3 | |
| n_jobs | None | |
| transformer_weights | None | |
| verbose | False | |
| verbose_feature_names_out | True | |
| force_int_remainder_cols | 'deprecated' |
['total_bedrooms', 'total_rooms']
Parameters
| missing_values | nan | |
| strategy | 'median' | |
| fill_value | None | |
| copy | True | |
| add_indicator | False | |
| keep_empty_features | False |
Parameters
| func | <function col...0025BF9C1CA40> | |
| inverse_func | None | |
| validate | False | |
| accept_sparse | False | |
| check_inverse | True | |
| feature_names_out | <function rat...0025BF9C1CB80> | |
| kw_args | None | |
| inv_kw_args | None |
Parameters
| copy | True | |
| with_mean | True | |
| with_std | True |
['total_rooms', 'households']
Parameters
| missing_values | nan | |
| strategy | 'median' | |
| fill_value | None | |
| copy | True | |
| add_indicator | False | |
| keep_empty_features | False |
Parameters
| func | <function col...0025BF9C1CA40> | |
| inverse_func | None | |
| validate | False | |
| accept_sparse | False | |
| check_inverse | True | |
| feature_names_out | <function rat...0025BF9C1CB80> | |
| kw_args | None | |
| inv_kw_args | None |
Parameters
| copy | True | |
| with_mean | True | |
| with_std | True |
['population', 'households']
Parameters
| missing_values | nan | |
| strategy | 'median' | |
| fill_value | None | |
| copy | True | |
| add_indicator | False | |
| keep_empty_features | False |
Parameters
| func | <function col...0025BF9C1CA40> | |
| inverse_func | None | |
| validate | False | |
| accept_sparse | False | |
| check_inverse | True | |
| feature_names_out | <function rat...0025BF9C1CB80> | |
| kw_args | None | |
| inv_kw_args | None |
Parameters
| copy | True | |
| with_mean | True | |
| with_std | True |
['total_bedrooms', 'total_rooms', 'population', 'households', 'median_income']
Parameters
| missing_values | nan | |
| strategy | 'median' | |
| fill_value | None | |
| copy | True | |
| add_indicator | False | |
| keep_empty_features | False |
Parameters
| func | <ufunc 'log'> | |
| inverse_func | None | |
| validate | False | |
| accept_sparse | False | |
| check_inverse | True | |
| feature_names_out | 'one-to-one' | |
| kw_args | None | |
| inv_kw_args | None |
Parameters
| copy | True | |
| with_mean | True | |
| with_std | True |
['latitude', 'longitude']
Parameters
| n_clusters | 45 | |
| gamma | 1.0 | |
| random_state | 42 |
<sklearn.compose._column_transformer.make_column_selector object at 0x0000025BFC2EBD70>
Parameters
| missing_values | nan | |
| strategy | 'most_frequent' | |
| fill_value | None | |
| copy | True | |
| add_indicator | False | |
| keep_empty_features | False |
Parameters
| categories | 'auto' | |
| drop | None | |
| sparse_output | True | |
| dtype | <class 'numpy.float64'> | |
| handle_unknown | 'ignore' | |
| min_frequency | None | |
| max_categories | None | |
| feature_name_combiner | 'concat' |
['housing_median_age']
Parameters
| missing_values | nan | |
| strategy | 'median' | |
| fill_value | None | |
| copy | True | |
| add_indicator | False | |
| keep_empty_features | False |
Parameters
| copy | True | |
| with_mean | True | |
| with_std | True |
Parameters
| n_estimators | 100 | |
| criterion | 'squared_error' | |
| max_depth | None | |
| min_samples_split | 2 | |
| min_samples_leaf | 1 | |
| min_weight_fraction_leaf | 0.0 | |
| max_features | 9 | |
| max_leaf_nodes | None | |
| min_impurity_decrease | 0.0 | |
| bootstrap | True | |
| oob_score | False | |
| n_jobs | None | |
| random_state | 42 | |
| verbose | 0 | |
| warm_start | False | |
| ccp_alpha | 0.0 | |
| max_samples | None | |
| monotonic_cst | None |
cv_res = pd.DataFrame(rnd_search.cv_results_)
cv_res.sort_values(by="mean_test_score", ascending=False, inplace=True)
cv_res = cv_res[["param_preprocessing__geo__n_clusters",
                 "param_random_forest__max_features", "split0_test_score",
                 "split1_test_score", "split2_test_score", "mean_test_score"]]
cv_res.columns = ["n_clusters", "max_features"] + score_cols
cv_res[score_cols] = -cv_res[score_cols].round().astype(np.int64)
cv_res.head()| n_clusters | max_features | split0 | split1 | split2 | mean_test_rmse | |
|---|---|---|---|---|---|---|
| 1 | 45 | 9 | 41342 | 42242 | 43057 | 42214 |
| 8 | 32 | 7 | 41825 | 42275 | 43241 | 42447 |
| 0 | 41 | 16 | 42238 | 42938 | 43354 | 42843 |
| 5 | 42 | 4 | 41869 | 43362 | 43664 | 42965 |
| 2 | 23 | 8 | 42490 | 42928 | 43718 | 43046 |
1.3.7.3 Analysing the Best Models and Their Errors
You will often gain good insights on the problem by inspecting the best models. For example, the RandomForestRegressor can indicate the relative importance of each attribute for making accurate predictions:
final_model = rnd_search.best_estimator_  # includes preprocessing
feature_importances = final_model["random_forest"].feature_importances_
feature_importances.round(2)
array([0.07, 0.05, 0.05, 0.01, 0.01, 0.01, 0.01, 0.19, 0.01, 0.02, 0.01,
0.01, 0.01, 0. , 0.01, 0.02, 0.01, 0.02, 0.01, 0. , 0.01, 0.02,
0.01, 0.01, 0.01, 0. , 0.02, 0.01, 0.01, 0. , 0.01, 0.01, 0.01,
0.03, 0.01, 0.01, 0.01, 0.01, 0.04, 0.01, 0.02, 0.01, 0.02, 0.01,
0.02, 0.02, 0.01, 0.01, 0.01, 0.01, 0.01, 0.01, 0.01, 0. , 0.07,
0. , 0. , 0. , 0.01])Let’s sort these importance scores in descending order and display them next to their corresponding attribute names:
sorted(zip(feature_importances,
           final_model["preprocessing"].get_feature_names_out()),
       reverse=True)
[(np.float64(0.18599734460509473), 'log__median_income'),
(np.float64(0.07338850855844488), 'cat__ocean_proximity_INLAND'),
(np.float64(0.06556941990883974), 'bedrooms__ratio'),
(np.float64(0.05364871007672531), 'rooms_per_house__ratio'),
(np.float64(0.04598870861894748), 'people_per_house__ratio'),
(np.float64(0.04175269214442518), 'geo__Cluster 30 similarity'),
(np.float64(0.025976797232869678), 'geo__Cluster 25 similarity'),
(np.float64(0.023595895886342252), 'geo__Cluster 36 similarity'),
(np.float64(0.02021056221732893), 'geo__Cluster 9 similarity'),
(np.float64(0.018606917076661445), 'geo__Cluster 34 similarity'),
(np.float64(0.01813798837462886), 'geo__Cluster 37 similarity'),
(np.float64(0.017404353166326745), 'geo__Cluster 18 similarity'),
(np.float64(0.01677838614384489), 'geo__Cluster 1 similarity'),
(np.float64(0.015459009666188978), 'geo__Cluster 7 similarity'),
(np.float64(0.015325731028175922), 'geo__Cluster 32 similarity'),
(np.float64(0.015073772015038346), 'geo__Cluster 13 similarity'),
(np.float64(0.014272160962173803), 'geo__Cluster 35 similarity'),
(np.float64(0.014180636461860477), 'geo__Cluster 0 similarity'),
(np.float64(0.01374636449823899), 'geo__Cluster 3 similarity'),
(np.float64(0.013572305708469519), 'geo__Cluster 28 similarity'),
(np.float64(0.012940349694228718), 'geo__Cluster 26 similarity'),
(np.float64(0.012738123746761943), 'geo__Cluster 31 similarity'),
(np.float64(0.011654237215152623), 'geo__Cluster 19 similarity'),
(np.float64(0.011628003598059721), 'geo__Cluster 6 similarity'),
(np.float64(0.011134113333125396), 'geo__Cluster 24 similarity'),
(np.float64(0.011042979326385047), 'remainder__housing_median_age'),
(np.float64(0.010907388443940416), 'geo__Cluster 43 similarity'),
(np.float64(0.010847192663592164), 'geo__Cluster 44 similarity'),
(np.float64(0.010592244492858262), 'geo__Cluster 10 similarity'),
(np.float64(0.010512467290844922), 'geo__Cluster 23 similarity'),
(np.float64(0.010458665615386447), 'geo__Cluster 41 similarity'),
(np.float64(0.010261910692851671), 'geo__Cluster 40 similarity'),
(np.float64(0.00975730698309749), 'geo__Cluster 2 similarity'),
(np.float64(0.009659933222114479), 'geo__Cluster 12 similarity'),
(np.float64(0.009574969190852867), 'geo__Cluster 14 similarity'),
(np.float64(0.008199144719918424), 'geo__Cluster 20 similarity'),
(np.float64(0.008141941480860804), 'geo__Cluster 33 similarity'),
(np.float64(0.00759676121996469), 'geo__Cluster 8 similarity'),
(np.float64(0.007576298012849029), 'geo__Cluster 22 similarity'),
(np.float64(0.007346290789504318), 'geo__Cluster 39 similarity'),
(np.float64(0.006898774333063982), 'geo__Cluster 4 similarity'),
(np.float64(0.006794731845079839), 'log__total_rooms'),
(np.float64(0.006514889773323567), 'log__population'),
(np.float64(0.006350528211987124), 'geo__Cluster 27 similarity'),
(np.float64(0.0063375587499023365), 'geo__Cluster 16 similarity'),
(np.float64(0.006231053672395538), 'geo__Cluster 38 similarity'),
(np.float64(0.006121348345871485), 'log__households'),
(np.float64(0.00584984200158211), 'log__total_bedrooms'),
(np.float64(0.005678310466685012), 'geo__Cluster 15 similarity'),
(np.float64(0.005479729990673466), 'geo__Cluster 29 similarity'),
(np.float64(0.005348325088535127), 'geo__Cluster 42 similarity'),
(np.float64(0.004866251452445484), 'geo__Cluster 17 similarity'),
(np.float64(0.004495340541933026), 'geo__Cluster 11 similarity'),
(np.float64(0.004418821635620684), 'geo__Cluster 5 similarity'),
(np.float64(0.003534473250529128), 'geo__Cluster 21 similarity'),
(np.float64(0.0018324246573418507), 'cat__ocean_proximity_<1H OCEAN'),
(np.float64(0.0015282226447271793), 'cat__ocean_proximity_NEAR OCEAN'),
(np.float64(0.00043259703422473606), 'cat__ocean_proximity_NEAR BAY'),
(np.float64(3.0190221102670295e-05), 'cat__ocean_proximity_ISLAND')]With this information, you may want to try dropping some of the less useful features (e.g., apparently only one ocean_proximity category is really useful, so you could try dropping the others).
You should also look at the specific errors that your system makes, then try to understand why it makes them and what could fix the problem: adding extra features or getting rid of uninformative ones, cleaning up outliers, etc.
Now is also a good time to check model fairness: it should not only work well on average, but also on various categories of districts, whether they’re rural or urban, rich or poor, northern or southern, minority or not, etc. This requires a detailed bias analysis: creating subsets of your validation set for each category, and analyzing your model’s performance on them. That’s a lot of work, but it’s important: if your model performs poorly on a whole category of districts, then it should probably not be deployed until the issue is resolved, or at least it should not be used to make predictions for that category, as it may do more harm than good.
1.3.7.4 Evaluate Your System on the Test Set
After tweaking your models for a while, you eventually have a system that performs sufficiently well. You are ready to evaluate the final model on the test set. There is nothing special about this process; just get the predictors and the labels from your test set and run your final_model to transform the data and make predictions, then evaluate these predictions:
X_test = strat_test_set.drop("median_house_value", axis=1)
y_test = strat_test_set["median_house_value"].copy()

final_predictions = final_model.predict(X_test)

final_rmse = root_mean_squared_error(y_test, final_predictions)
print(final_rmse)41445.533268606625We can compute a 95% confidence interval for the test RMSE using SciPy’s bootstrap() function:
from scipy import stats

def rmse(squared_errors):
    return np.sqrt(np.mean(squared_errors))

confidence = 0.95
squared_errors = (final_predictions - y_test) ** 2
boot_result = stats.bootstrap([squared_errors], rmse,
                              confidence_level=confidence, random_state=42)
rmse_lower, rmse_upper = boot_result.confidence_interval

print(f"95% CI for RMSE: ({rmse_lower:.4f}, {rmse_upper:.4f})")
95% CI for RMSE: (39520.9572, 43701.7681)1.3.8 Launch, Monitor, and Maintain the System
It’s often a good idea to save every model you experiment with so that you can come back easily to any model you want. You may also save the cross-validation scores and perhaps the actual predictions on the validation set. This will allow you to easily compare scores across model types, and compare the types of errors they make.
Then you can deploy your model to your production environment. The most basic way to do this is just to save the best model you trained, transfer the file to your production environment, and load it. To save the model, you can use the joblib library like this:
import joblib

joblib.dump(final_model, "my_california_housing_model.pkl")['my_california_housing_model.pkl']Now you can deploy this model to production. For example, the following code could be a script that would run in production:
import joblib

# extra code – excluded for conciseness
from sklearn.cluster import KMeans
from sklearn.base import BaseEstimator, TransformerMixin
from sklearn.metrics.pairwise import rbf_kernel

def column_ratio(X):
    return X[:, [0]] / X[:, [1]]

#class ClusterSimilarity(BaseEstimator, TransformerMixin):
#    [...]

final_model_reloaded = joblib.load("my_california_housing_model.pkl")

new_data = housing.iloc[:5]  # pretend these are new districts
predictions = final_model_reloaded.predict(new_data)
predictions
array([441046.12, 454713.09, 104832. , 101316. , 336181.05])Perhaps the model will be used within a website: the user will type in some data about a new district and click the Estimate Price button. This will send a query containing the data to the web server, which will forward it to your web application, and finally your code will simply call the model’s predict() method (you want to load the model upon server startup, rather than every time the model is used). Alternatively, you can wrap the model within a dedicated web service that your web application can query through a REST API. This makes it easier to upgrade your model to new versions without interrupting the main application. It also simplifies scaling, since you can start as many web services as needed and load-balance the requests coming from your web application across these web services. Moreover, it allows your web application to use any programming language, not just Python.

If the data keeps evolving, you will need to update your datasets and retrain your model regularly. You should probably automate the whole process as much as possible. Here are a few things you can automate:
Collect fresh data regularly and label it (e.g., using human raters).
Write a script to train the model and fine-tune the hyperparameters automatically. This script could run automatically, for example every day or every week, depending on your needs.
Write another script that will evaluate both the new model and the previous model on the updated test set, and deploy the model to production if the performance has not decreased (if it did, make sure you investigate why). The script should probably test the performance of your model on various subsets of the test set, such as poor or rich districts, rural or urban districts, etc.
You should also make sure you evaluate the model’s input data quality. Sometimes performance will degrade slightly because of a poor-quality signal (e.g., a malfunctioning sensor sending random values, or another team’s output becoming stale), but it may take a while before your system’s performance degrades enough to trigger an alert. If you monitor your model’s inputs, you may catch this earlier. For example, you could trigger an alert if more and more inputs are missing a feature, or the mean or standard deviation drifts too far from the training set, or a categorical feature starts containing new categories.
Finally, make sure you keep backups of every model you create and have the process and tools in place to roll back to a previous model quickly, in case the new model starts failing badly for some reason. Having backups also makes it possible to easily compare new models with previous ones. Similarly, you should keep backups of every version of your datasets so that you can roll back to a previous dataset if the new one ever gets corrupted (e.g., if the fresh data that gets added to it turns out to be full of outliers). Having backups of your datasets also allows you to evaluate any model against any previous dataset.
As you can see, machine learning involves quite a lot of infrastructure. This is a very broad topic called ML Operations (MLOps), which deserves its own book. So don’t be surprised if your first ML project takes a lot of effort and time to build and deploy to production. Fortunately, once all the infrastructure is in place, going from idea to production will be much faster.
Assignment 1:
Tackle a regression task of your choice by following the process you learned in this chapter. For example, you can try tackling the Vehicle dataset, where the goal is to predict the selling price of a used car, based on its age, the number of kilometers it has driven, its make and model, and more. Another good dataset to try is the Bike Sharing dataset: the objective is to predict the number of bikes rented within a period of time (column cnt), based on the day of the week, the time, and the weather conditions.
Some alternatives you can try (not mandatory):
Try a support vector machine regressor (
sklearn.svm.SVR) with various hyperparameters, such askernel="linear"(with various values for theChyperparameter) orkernel="rbf"(with various values for theCandgammahyperparameters). Note that support vector machines don’t scale well to large datasets, so you should probably train your model on just the first 5,000 instances of the training set and use only 3-fold cross-validation, or else it will take hours. Don’t worry about what the hyperparameters mean for now.Try replacing the
GridSearchCVwith aRandomizedSearchCV.
Finally, explain your results and what you encountered during the process.
References:
Disclaimer: Some of the material in this notebook is adapted from other sources. These references are provided for further reading and to acknowledge the original authors.
- Chapter 2 Hands-On Machine Learning with Scikit-Learn, Keras, and TensorFlow by Aurélien Géron, 3rd edition